
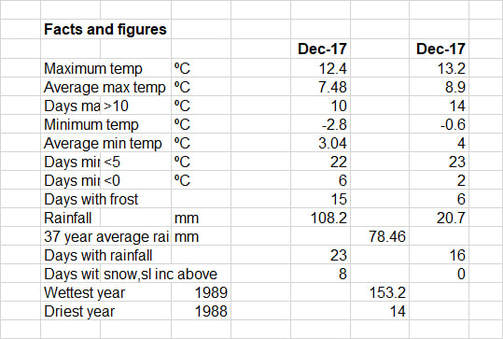
December 2017
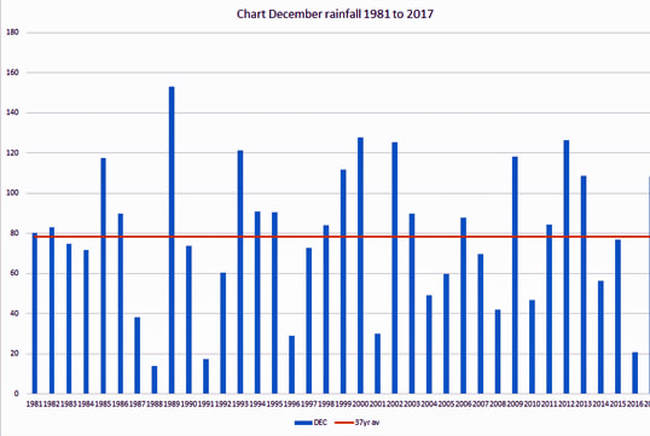
December was a wet month with rainfall some 25% greater than the 37 year average. The state of the ground reminds us of this even now well into January. As you will remember we had two periods of snow fall; this is unusual especially early in December. Snow causes a difficulty with the equivalent rainfall measurement. I have to assume that the snow building up above the rim of the gauge will melt and give a reasonably accurate measure. When it rains first, the other rule of thumb of a foot of snow being equivalent to 1 inch of rain (30.5 cm and 25 mm) is not easy to apply. I measured 6.5 in depth of snow that is approx. 12 mm rain equivalent. All in all it looked sensible! There was precipitation on 23 days which made for quite a gloomy month. We had frost at least on cars etc on 15 days (only 6 days when the minimum temperature was below 0°C; air frost versus ground frost). Temperature wise this last December was similar to December in 2016.
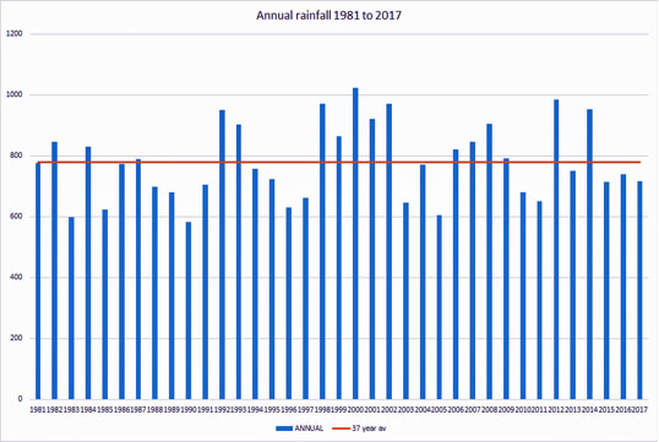
Despite December being a wet month you may have noticed how little flow there is in the Misbourne and the Chess. Partly I assume because the Water Board are taking a great deal but also because the rain through the year came at the wrong time. The water table is replenished October through to March; last February, March and April were dry as were October and November. The rain in July was heavy but that doesn’t get to the water table. This January to March needs to be above average if the water table is to recover. 2017 overall was just about average rainfall wise but the monthly pattern is important
December was a wet month with rainfall some 25% greater than the 37 year average. The state of the ground reminds us of this even now well into January. As you will remember we had two periods of snow fall; this is unusual especially early in December. Snow causes a difficulty with the equivalent rainfall measurement. I have to assume that the snow building up above the rim of the gauge will melt and give a reasonably accurate measure. When it rains first, the other rule of thumb of a foot of snow being equivalent to 1 inch of rain (30.5 cm and 25 mm) is not easy to apply. I measured 6.5 in depth of snow that is approx. 12 mm rain equivalent. All in all it looked sensible! There was precipitation on 23 days which made for quite a gloomy month. We had frost at least on cars etc on 15 days (only 6 days when the minimum temperature was below 0°C; air frost versus ground frost). Temperature wise this last December was similar to December in 2016.
Despite December being a wet month you may have noticed how little flow there is in the Misbourne and the Chess. Partly I assume because the Water Board are taking a great deal but also because the rain through the year came at the wrong time. The water table is replenished October through to March; last February, March and April were dry as were October and November. The rain in July was heavy but that doesn’t get to the water table. This January to March needs to be above average if the water table is to recover. 2017 overall was just about average rainfall wise but the monthly pattern is important
Gary Beynon
|
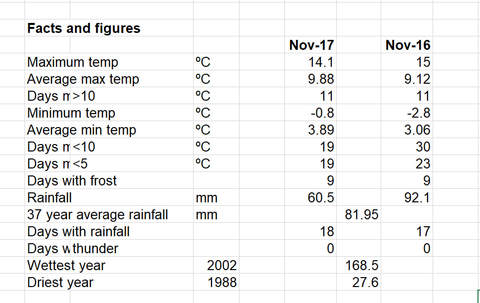
November 2017
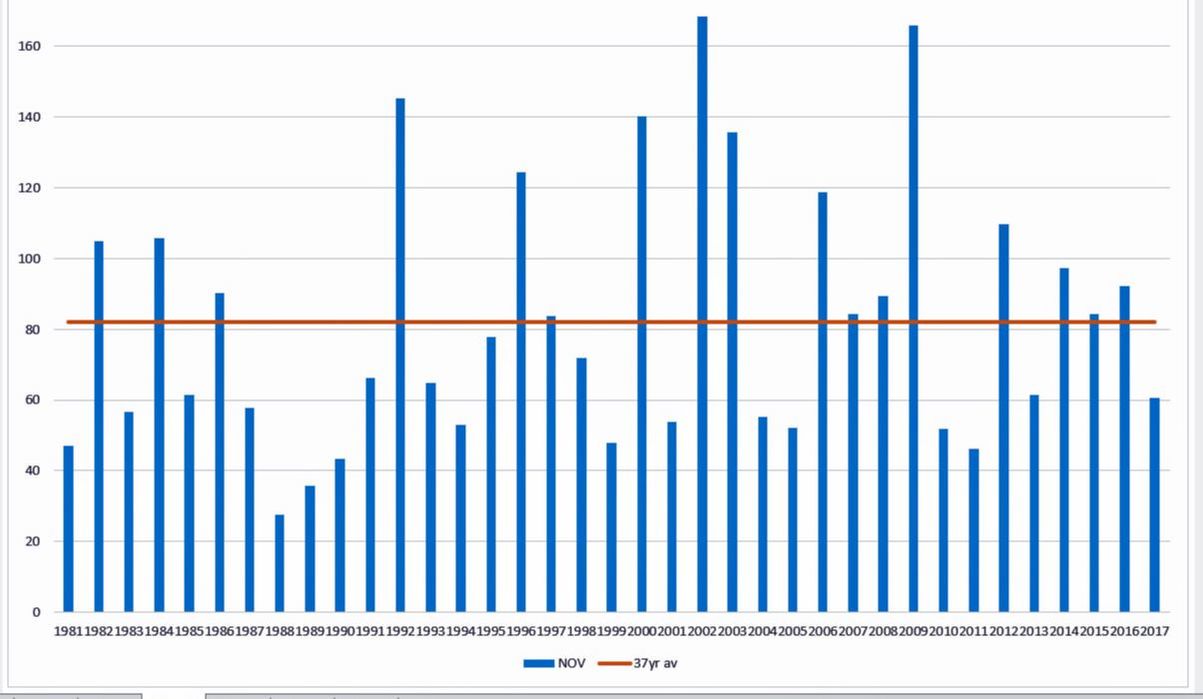
A normal November is probably the best way to sum it all up. It seemed wet because there were 18 days when some rain fell although the majority fell on just 4 days, 3 of which were early in the month. Yet again the total rainfall at 60.5 mm was below the 37 year average of 81.95 mm and a long way below the wettest year (2002) at 168.5 mm. The early part of the month was mild with many days in double figures, later the temperatures fell and there was frost evident on 9 days. Compared with November last year, this month was drier, and marginally warmer. November Rainfall stats to 2017
|
|
Gary Beynon
