Hyde Heath Weather Reports 2020 ... by Gary Beynon from his own observations
January
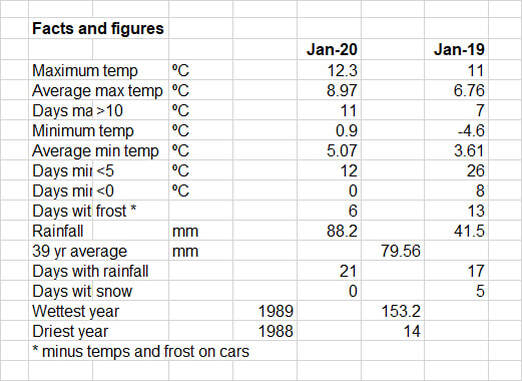
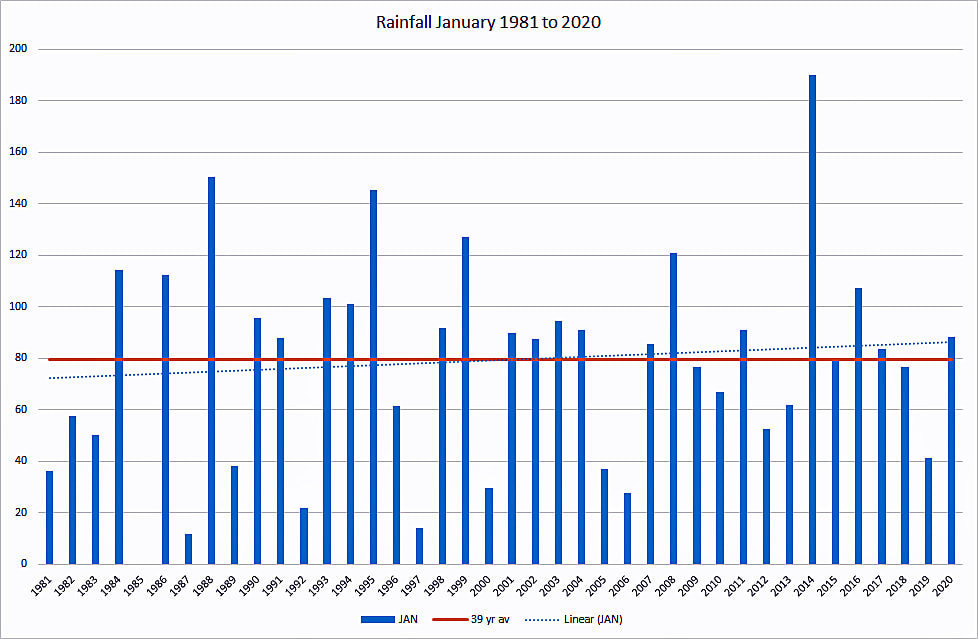
January was another wet month with 21 days with some rainfall.2 days in the middle of the month contributed 45% of the total; the other amounts kept everything wet and muddy. Rainfall was above average and over the last 39 years there has been a small increase in the average. Unlike 2019 there was no snow! The total rainfall so far this winter is 430mm compared with 280mm last winter. Overall it was a mild month with temperatures higher than last January particularly in respect of the minimum (0.9 cf -4.6°). The Met Office reported a very high pressure system and Hyde Heath had a pressure of 1041mB on 20th, this is 30.74 ins in old money. We normally do not see anything much higher than 1030Mb
February
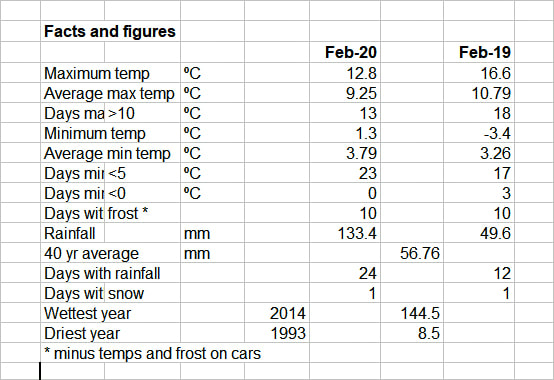
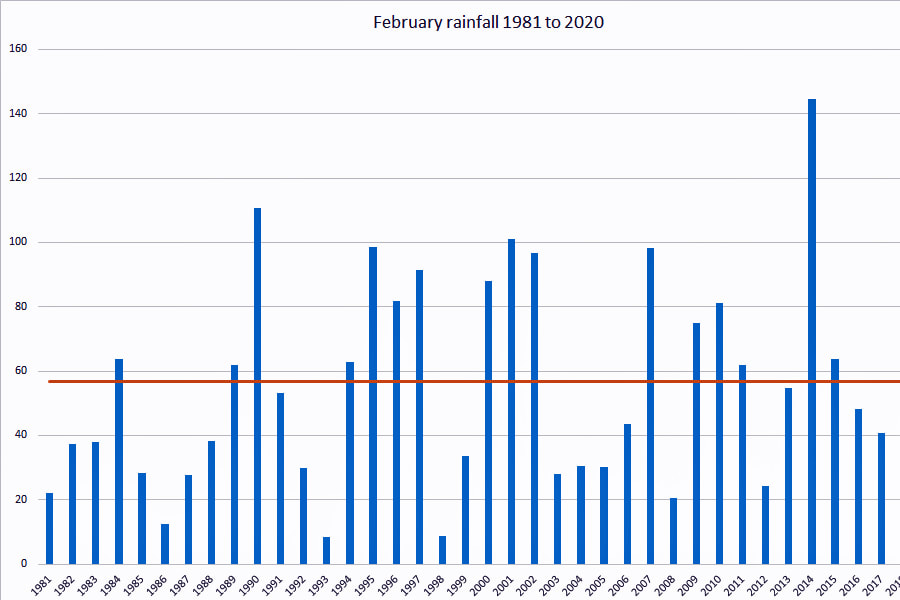
You do not need me to tell you that it was a wet month! We had 3 named storms and a lot of rain. The Met Office said that it was the wettest February on record; that was clearly the case for some parts of the country where I believe the Brecon Beacons had more rain in 24 hours than Hyde Heath had in the month. 2014 was actually wetter in Hyde Heath than this year. It was also a mild month with a maximum temperature of 12.8° (cf 16.6° in 2019) although as you would expect there were frosts overnight on 11 mornings. The ground is saturated with water standing on many of the fields and there is water in the Misbourne and the lake by the Chiltern Hospital for the first time in ages. The water table must be high; perhaps they will find that they cannot dig the HS2 tunnel because it would be an underground river!
March
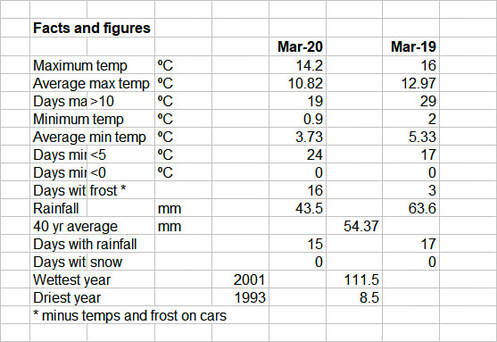
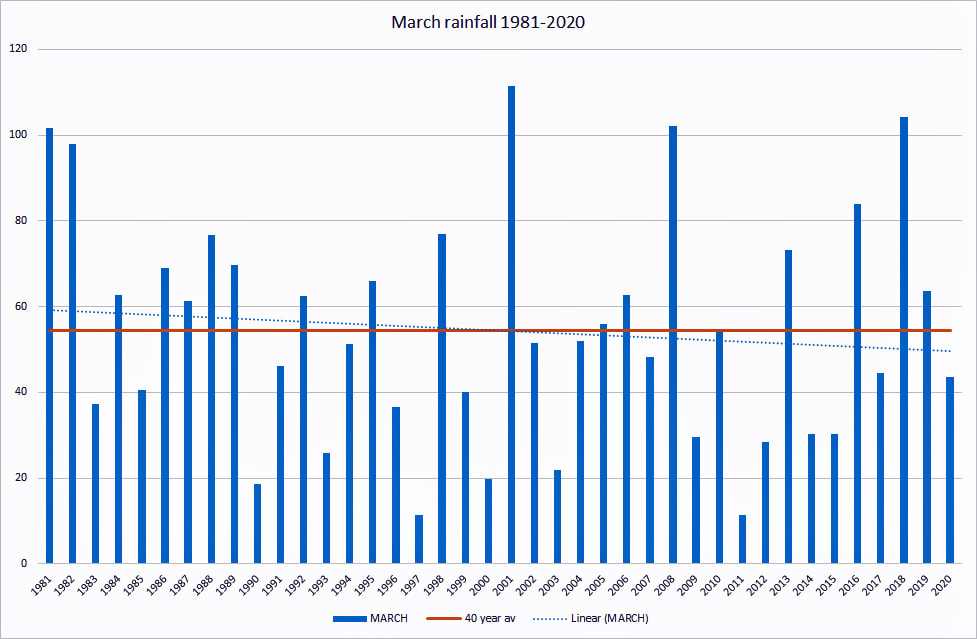
Having reported “wet, wet , wet” for so many months, March was much drier with somewhat below average rainfall over the last 40 years. Compared with March 2019 it was drier and significantly cooler with average max and min temperatures some 2° lower. Virtually all the rain was in the first half of the month and most of the frosts in the second half. I usually judge frost by looking out of the bedroom window first thing at the top of Ruth Coulton’s convertible; the black canvas shows frosts really well! Despite the drier month there is still water in the Misbourne below Missenden Abbey and a large amount in the field opposite the Vicarage in Little Missenden; haven’t seen that much for many a year.
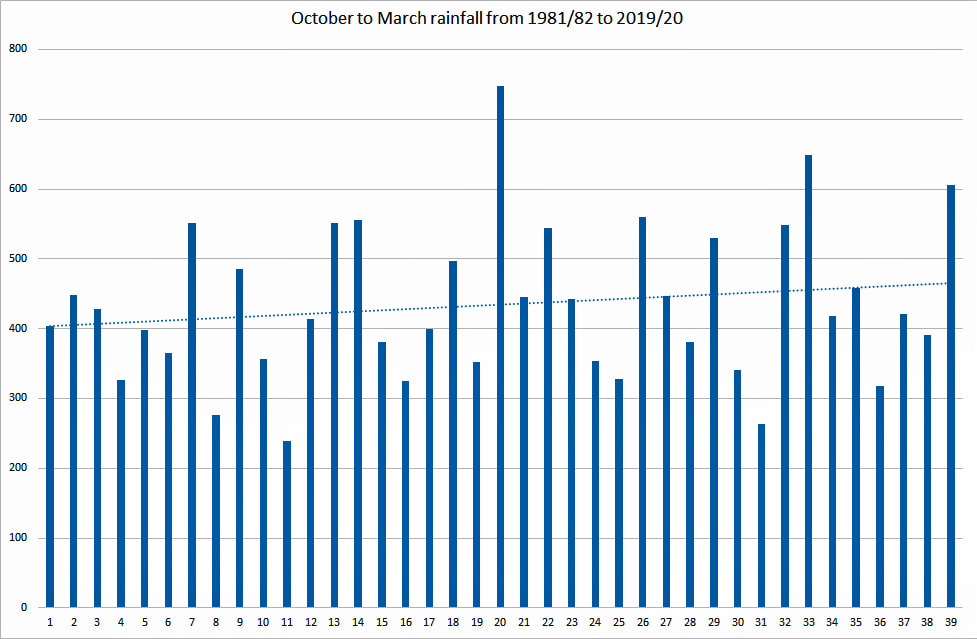
The winter rainfall over the last 39 years ie October to March the following year shows that there is an upward trend and that 2019 to 2020 was the 3rd wettest in that period
The winter rainfall over the last 39 years ie October to March the following year shows that there is an upward trend and that 2019 to 2020 was the 3rd wettest in that period
April
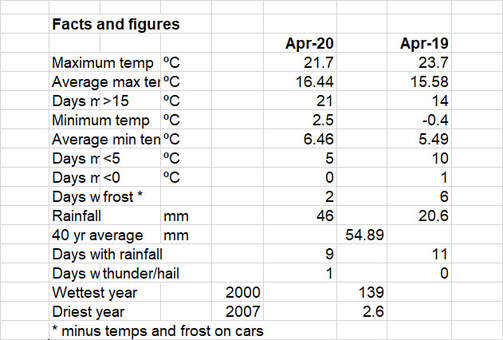
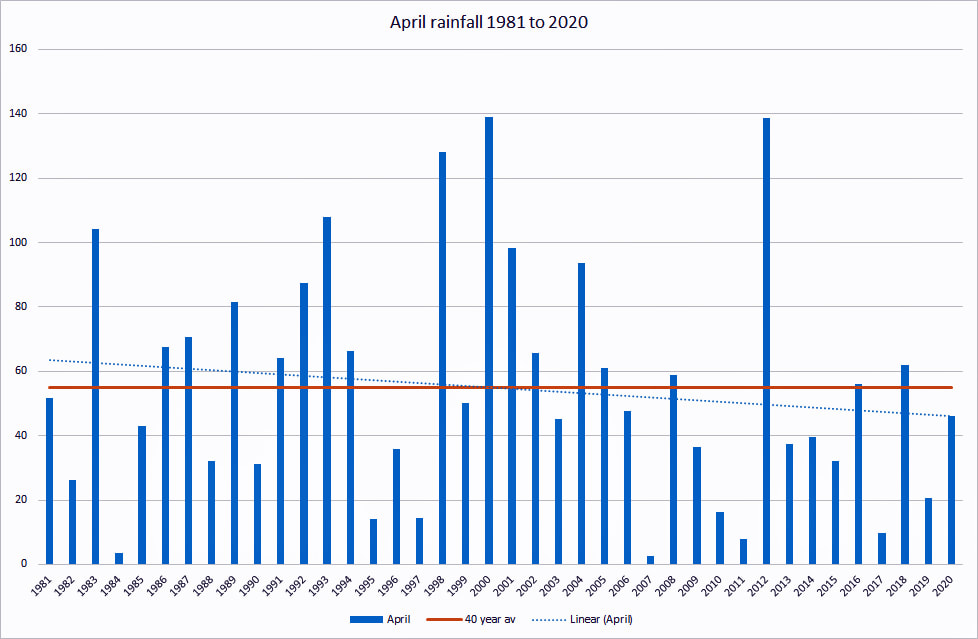
We would appear to be back to the dry months again; although rainfall was not much below average for April, the rain that we did have fell on mostly just 6 days and 3 of those days accounted for about 85% of the total. The first half continued the dry spell that started on 20th March and went through to the 16th April; that is when the grass started to grow again! Compared with April 2019, this month was wetter but not really the April showers that the month is renowned for. The real sting in the tail was the thunder and hail storm on the 30th that saw some 12mm in a little over an hour. Temperatures were quite pleasant with 7 days above 20°C and not that different from 2019. Fortunately we did have a lot of sunny days so looking out during this continuing lockdown was more pleasant than it might have been.
May
June
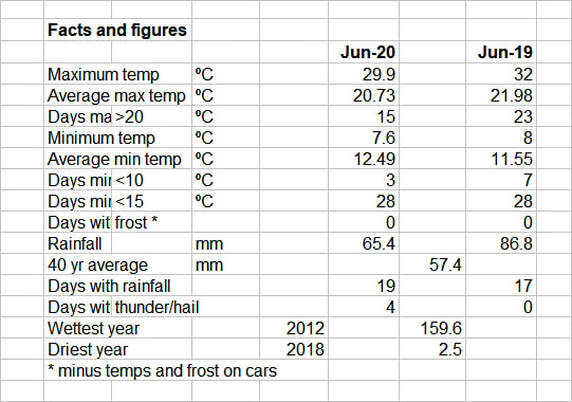
Quite a mixture of weather with a number of warm/hot spells interspersed with cooler and wetter periods.
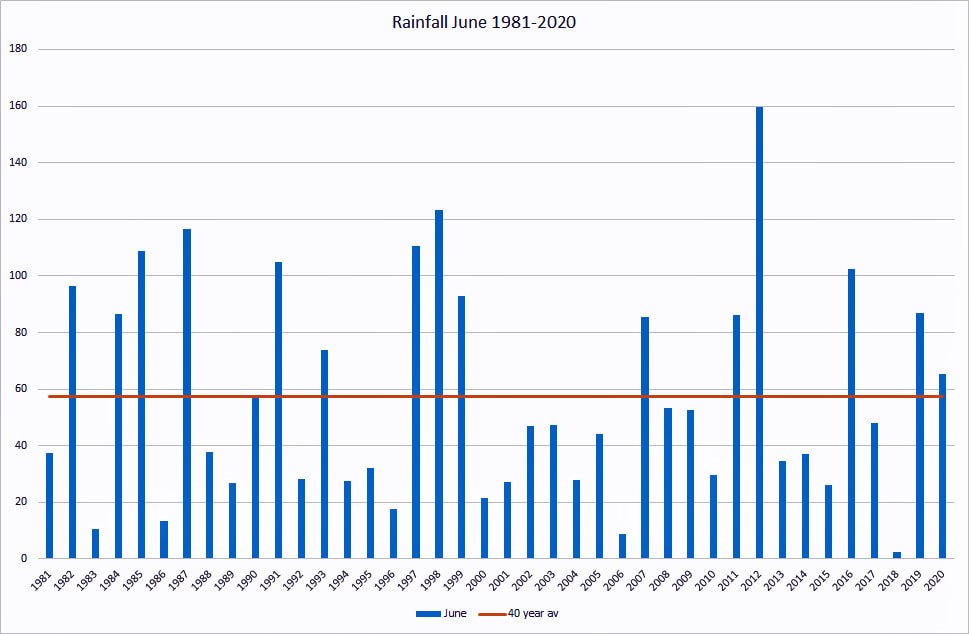
The temperature hit a high of 29.9° on 2 days but dropped to 15° on 2 other days. Rainfall was a little below the 40 year average at 65.4mm with 25mm falling on just one day.
Compared with June 2019, it was a little cooler and a little drier but not significantly. Probably what one might describe as a typical June in the UK.
July
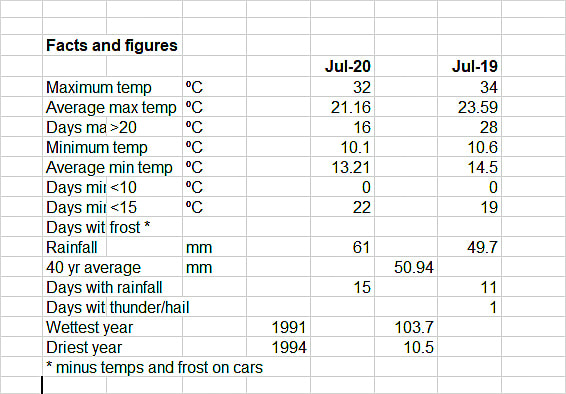
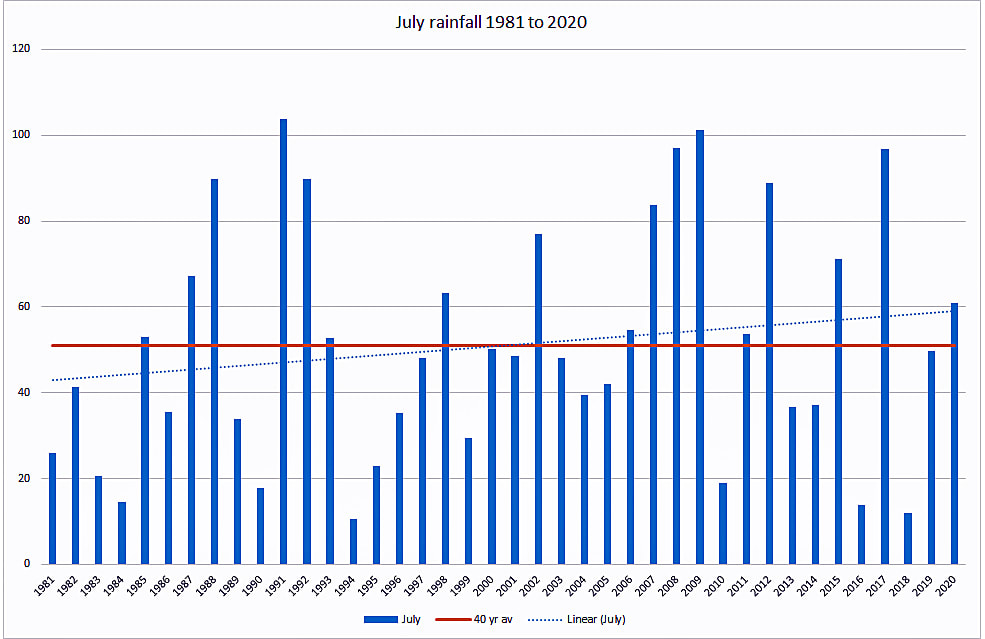
July was not a particularly memorable month; the weather was mixed with a good deal of cloud on too many days. There were only 9 days when it was mainly sunny in contrast with 14 days when it was predominately cloudy. There was rain on 15 days giving a total of 61 mm; this is above the 40 year average of 50.94 mm.
Over the period from 1981 the trend has been for the rainfall to increase.
Compared with last year, July was wetter and cooler. Some parts of the country recorded the 3rd hottest day on record on 31st; Hyde Heath had 32° which was actually 2° below last year on 25th.
In past years we would have said to expect August to be not much good because the schools are on holiday; in this rather strange year the children have mostly not been in school for months; as always we will have to wait and see!
August
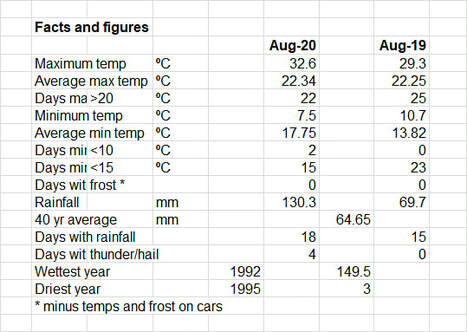
Rather a strange month which we may remember for the high temperatures in the first half and the very heavy rain—with thunder and the inevitable power cuts—in the last 10 days.
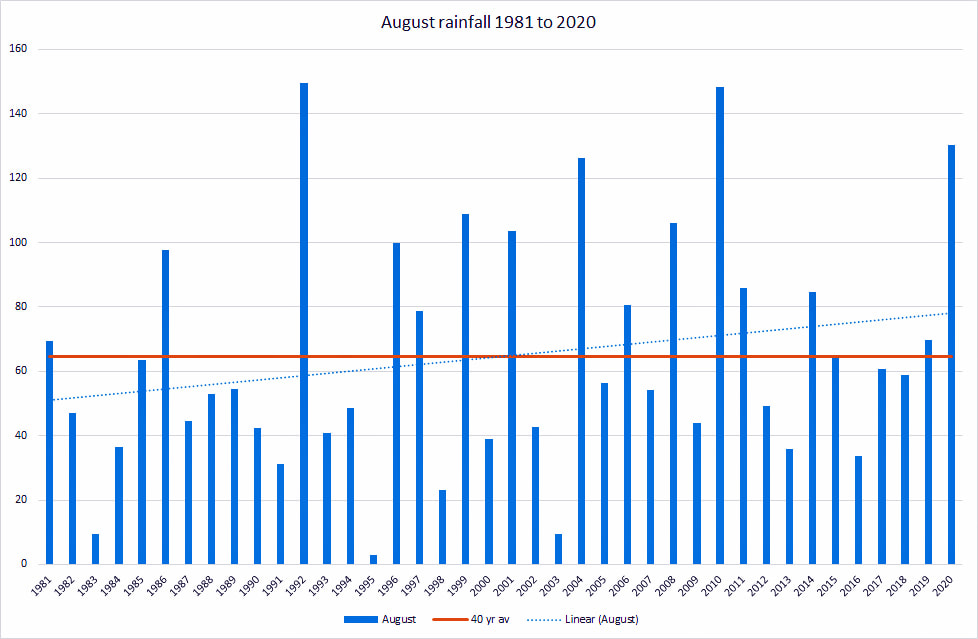
The wettest day with 26mm was the 28th but 5 other days all had between10.2 and 17.3mm so little wonder that the month total was 130.3mm. August over the years has been something of a mixture with either a lot of rain or reasonably dry.
The 40 year average is 64.65mm and the trend is for it to get wetter but with such large variations I am not sure that this is that meaningful. We always hope that August will be sunny and warm for the school holidays but experience shows that it often disappoints.
Compared with last year this August was on average the same maximum temperature wise but had warmer nights. Rainfall was virtually double compared with last year but the same level of wet days.
Apparently the wheat harvest has been poor due to a combination of the wrong weather at crucial times and then too much wet when harvesting was taking place.
My runner beans have certainly suffered from not enough water when it was needed to give a good crop but apples are some 2 weeks ahead of the norm because the weather was right for them.
September
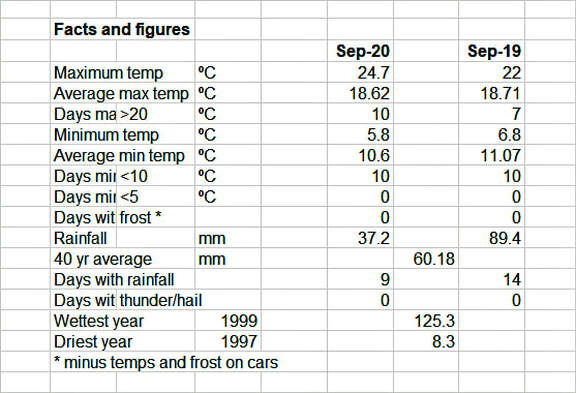
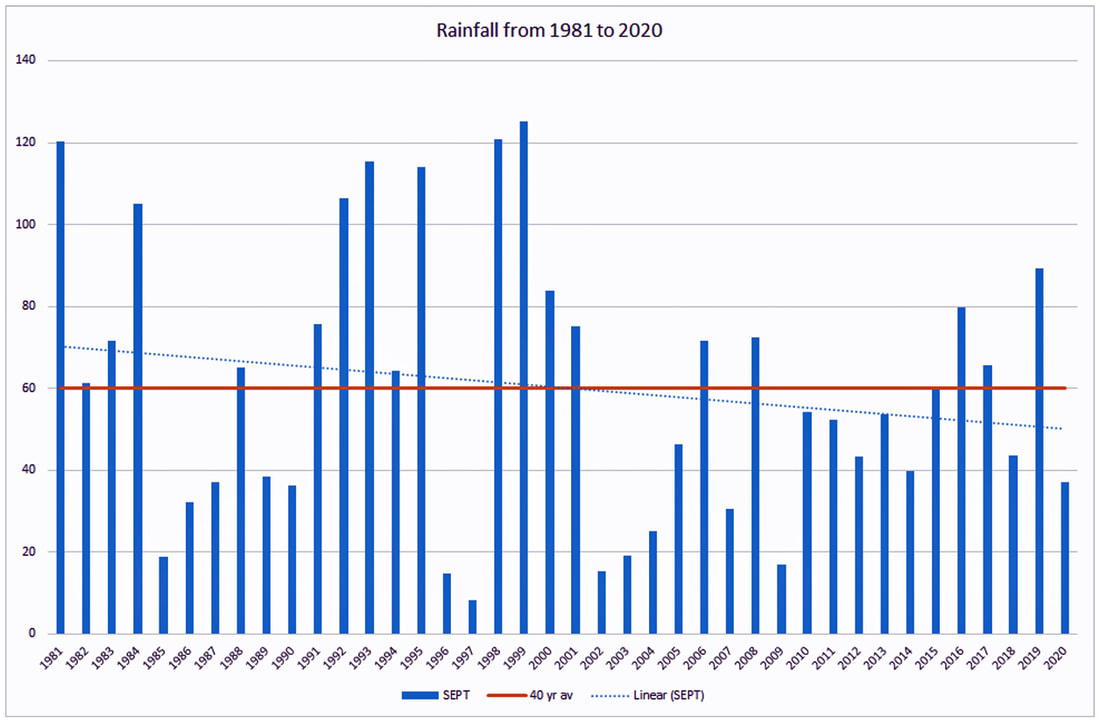
Mostly a very pleasant month with 14 days of sunny weather and a number of others when there was sunshine for at least half the time. Temperatures matched the sun with a maximum of 24.7° and 10 days above 20°. It was a dry month with just 37.2 mm well below the 40 year average of 60 mm, and a fraction of the rainfall in 1999 which saw some 125 mm. The 40 year trend suggests that Septembers are becoming marginally drier but still 50% of the months show above average rain; you can make figures say anything you wish if you do not look at the full picture! Most notable was the step fall in temperature on 24th when we went from 21.6 on the 22nd to just 14.5. It certainly became wetter towards the month end with 31 of the total 37 mm falling in the last 8 days. As we move into October, it looks if it was getting into practice for the deluge experienced in the first 4 days.
October
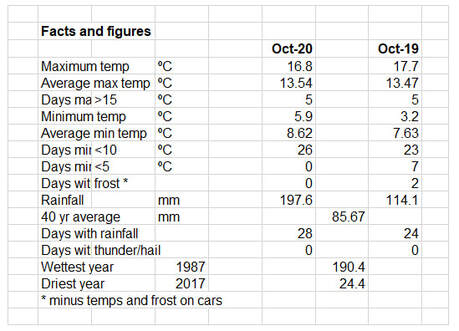
A record month!
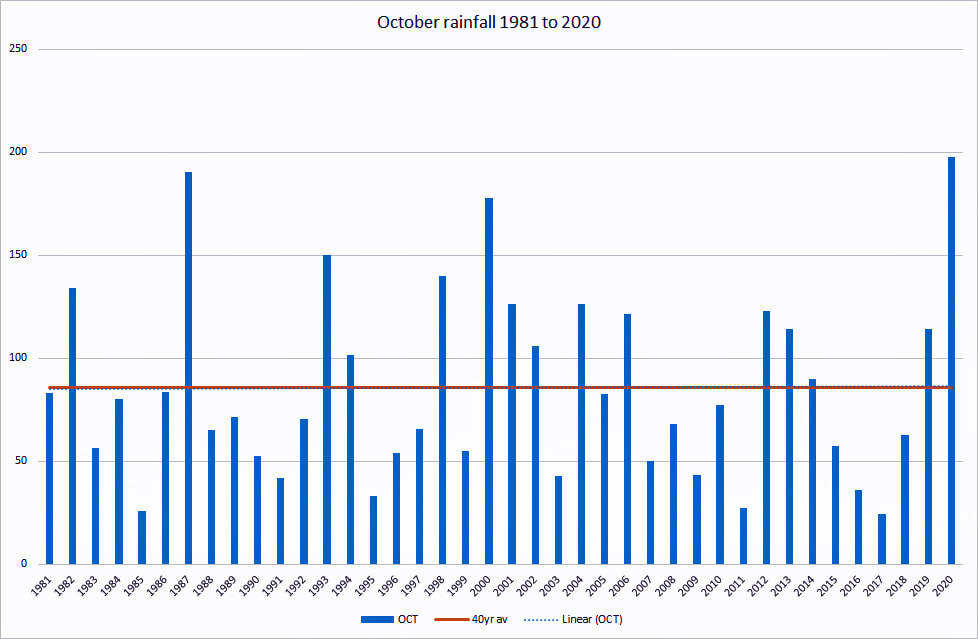
October was the wettest month that I have recorded in the last 40 years at 197.6mm. The previous wettest month was also in October in 1987 at 190.4mm; contrast these figures with the driest October in 2017 with just 24.4mm and the 40 year average of 85.67mm.
There was some rainfall on 28 days with the wettest being on the 2nd with 50.6mm closely followed by the 3rd with 39.1mm. In all there were 5 days with more than 10mm of rain accounting for 116mm of the overall total. This is the first of the so called “fill dyke” months when the rain starts to replenish the water table; a good start!
As far as the temperatures were concerned maximum, minimum and average figures were very similar to 2019. I suspect that other people will have had a similar experience to me with runner beans still pickable into the third week of the month and very tasty and not stringy.
Certainly a month to remember.
November
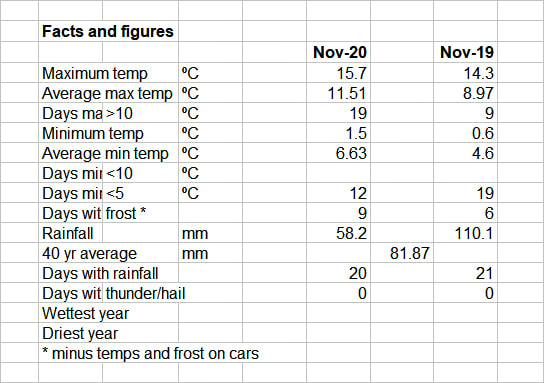
November was nowhere near as wet as October but the rain we did have fell on already saturated ground.
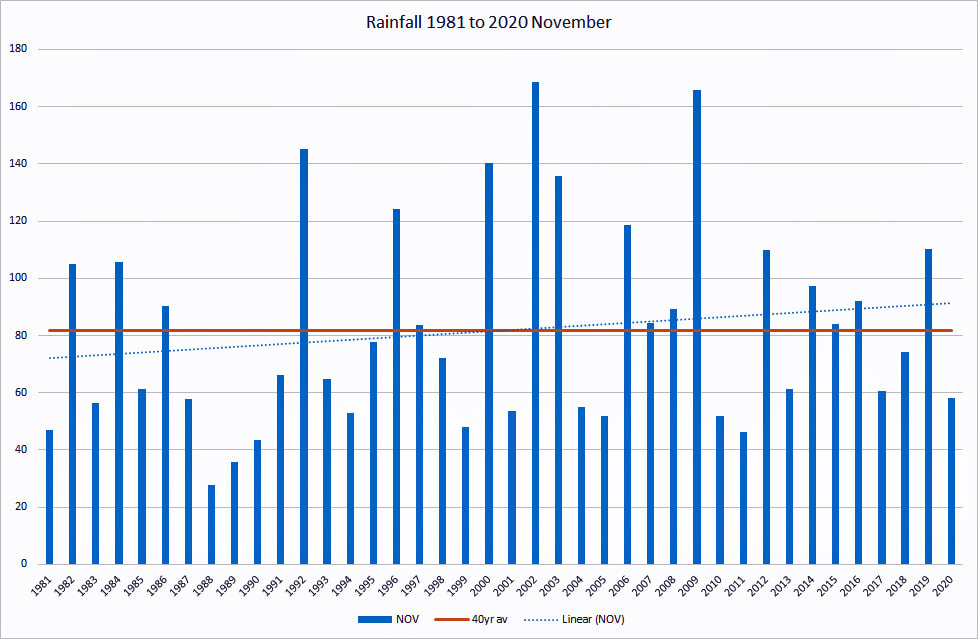
Rainfall was below the 40 year average and there was a measureable amount on 21 days.
Although temperatures were higher than one would expect in November being 2.5° higher than a year ago there was still frost evident on 9 mornings.
November is always unpredictable; highest rainfall was in 2002 at 168.5mm and the lowest in 1988 at 27.6mm. It is of course quite possible to have snow in this month but fortunately not this year.
I wonder if the coronavirus is having an effect on the weather ! ?
December
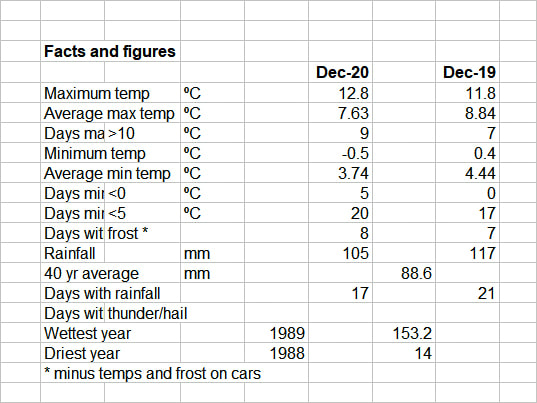
A month that showed considerable variation often on a day by day basis. The 23rd saw a maximum temperature of 12°whereas Christmas Eve was 4.3° and a frost.
There were mild patches although temperatures did fall away in the last week. As far as rainfall was concerned, it was a wet month with 105mm over 17 days, the wettest being 13th with 15.8 mm.
December is generally a time when the weather can’t really make up its mind whether to be winter or the last part of autumn.
Rainfall varies from a low of 14 mm to a high of 153 mm with just about everything in between. Over the last 40 years the average for
December has been 88.6 mm with 21 years above this figure and 9 well below. It is also getting wetter as a trend having increased from about 75 to 85 mm during that time.
Compared with last year, the month was a little warmer and marginally drier. At least we didn’t have snow---which we certainly have had although the chances of a white Christmas are rather remote. Onward into 2021—what will it hold for us in lots of different ways?!
ANNUAL RAINFALL OVER 40 YEARS
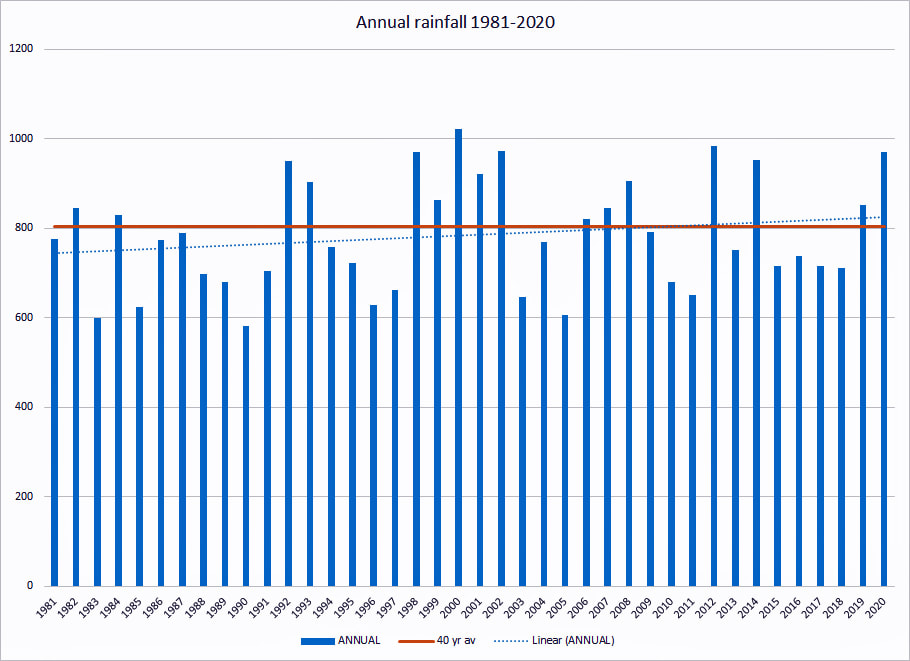
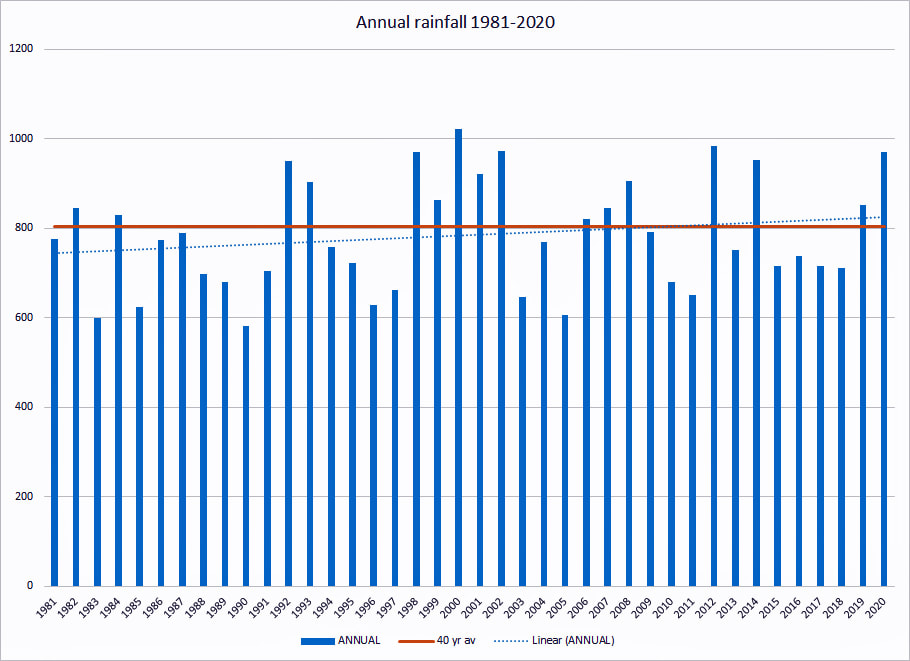
2020 was a wet year with 970 mm of rainfall compared with an average of just over 800mm. The trend over that time is also going up as shown on the second graph below.
Significant?---not sure but I think there is enough data to show that there is an upwards trend which I would see as somewhat disturbing.

