Hyde Heath Weather Reports 2019 .... by Gary Beynon from his own observations
January
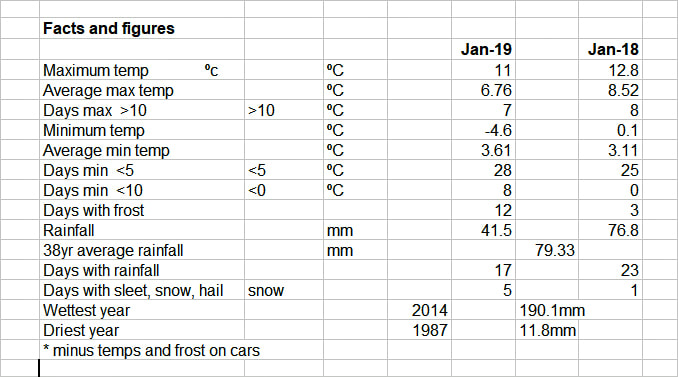
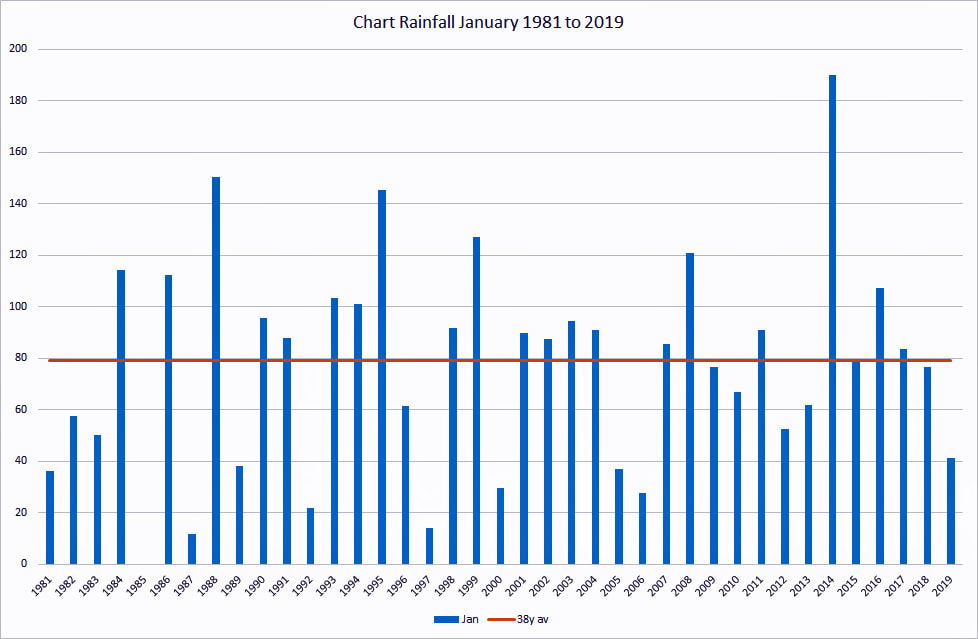
Daytime temperatures in January were reasonably mild although not as warm as 2018, the night time in contrast was colder with more frosts. It was a month with a sting in the tail as there was snow and this caused the inevitable disruption despite the relatively small amount. It was, yet again for this winter, a relatively dry month with only half the average rainfall even though there was some ”wet” on 17 of the days. There were many days of cloud when the sky seemed to be on top of us which is a bit depressing and such a contrast with a sunny day when the blue seems to go on forever. January does seem to go in for extremes; the difference between the wettest in 39 years at 190mm and the driest at 12mm is marked.
February
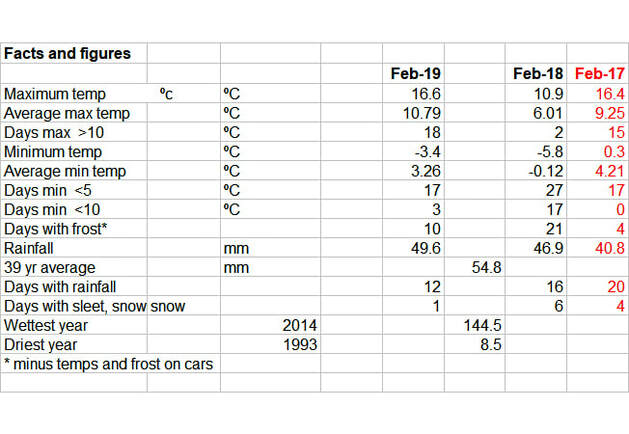
The Met Office reported that this February was the warmest since their records began. Hyde Heath followed suite although we were unable to match the dizzy heights of 20° and above.
It is however not unusual for us to get carried away by the headlines; as recently as 2017 our temperatures in Hyde Heath were only marginally below what we saw this year.
Compared with last year—the so called “beast from the east”—temperatures were considerably higher with a 6° increase in the maximum and a 4.8° increase in the average. I have include February 2017 for comparative purposes.
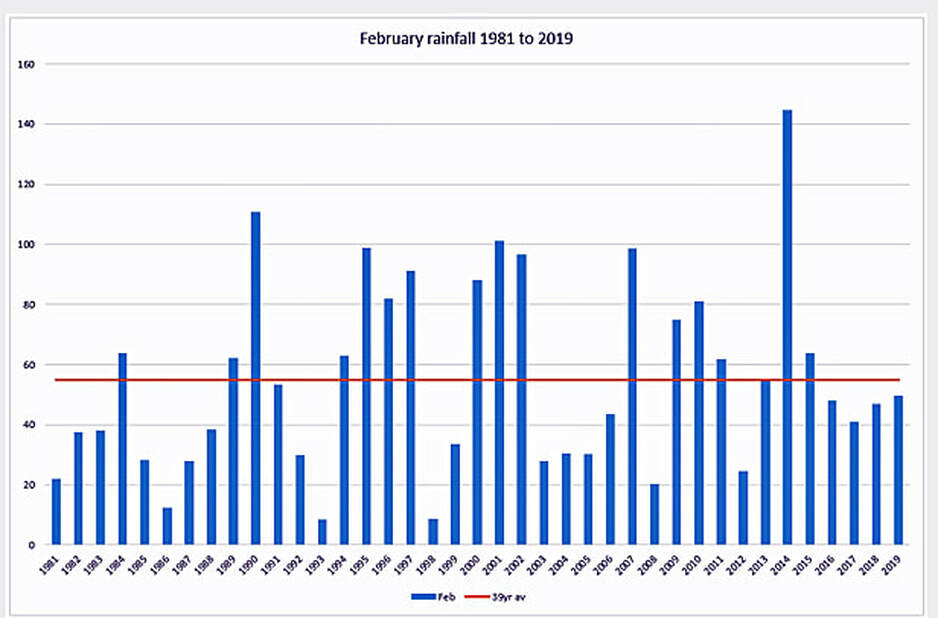
Although the rainfall for the month was only a little below the 39 year average, it was a further month in this cycle of “fill dyke” where the water table will have been unaffected. The ground is still very dry and the Misbourne has hardly the sort of flow that one might hope for at this stage of the winter. The month started cold and wet (it did look as if the rainfall was going to make up for the dry months) but that all stopped after the 10th with very little rain and maximum temperatures steadily increasing. St David’s Day—1st March—marked the “official” Met Office start of Spring; I wonder what I will be reporting by the end of it?
March
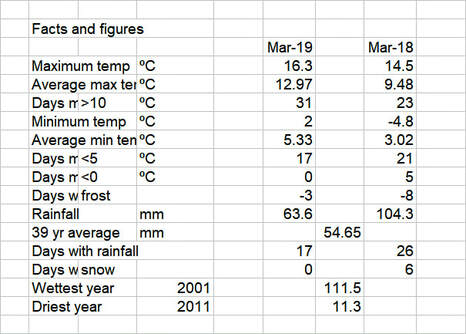
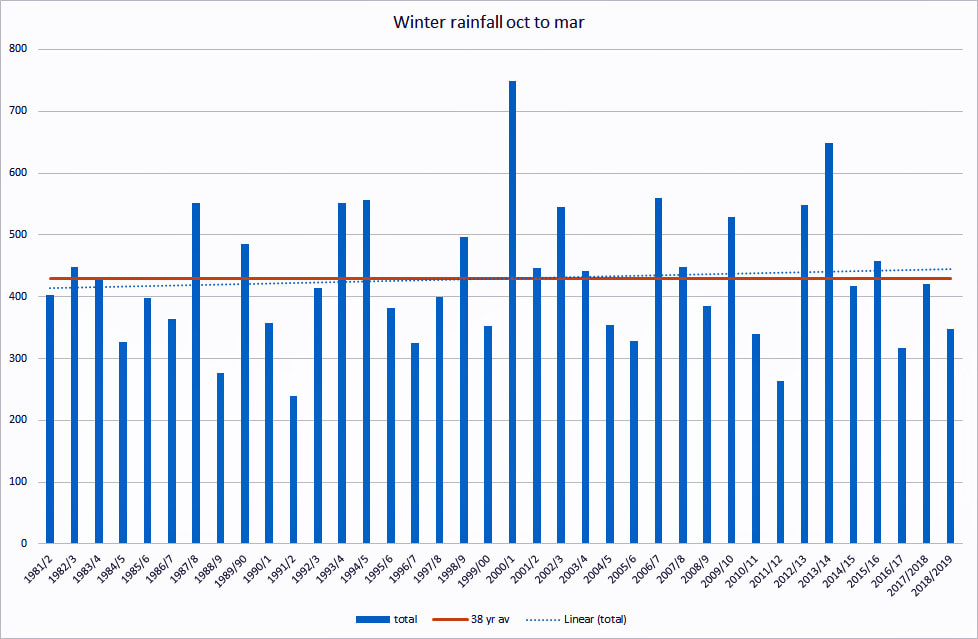
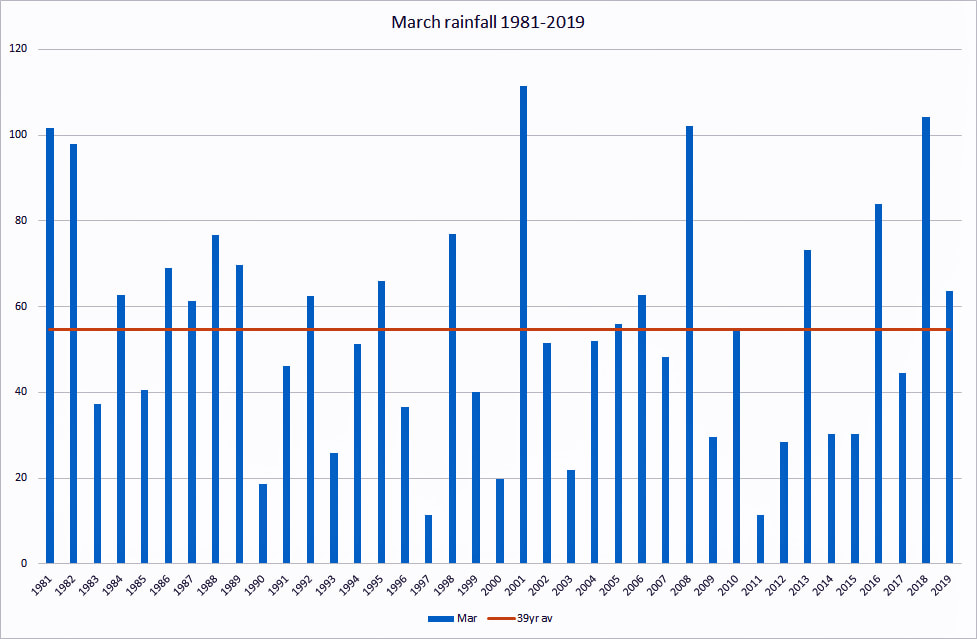
March fell into two distinct halves; the first 18 days saw some level of rainfall and a great deal of cloud, whereas the last 13 days were dry and partly cloudy with temperatures up at least 2° on average. Rainfall was greater than the 39 year average but only 60% of March last year. Looking at the “winter” rainfall (rain during the months from October to March) showed a dryish winter with amounts below average; however the trend over that period is just slightly increasing. This March was nowhere near as cold as in 2018 with 3days of frost compared with 9 and a minimum of 2° compared with -4.8°. The maximum temperature of 16.3° was 2° above last year but the average temperature was 3.5° higher.
April
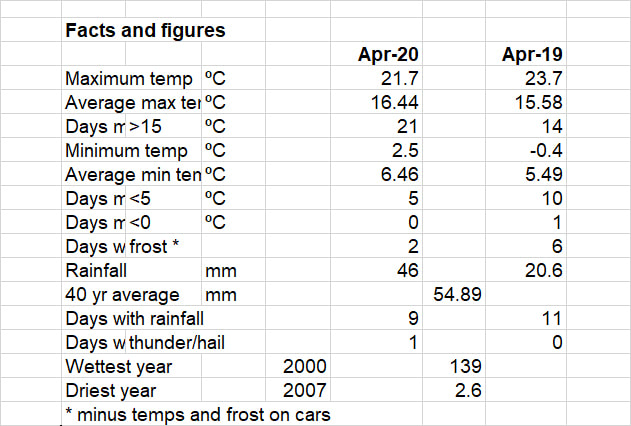
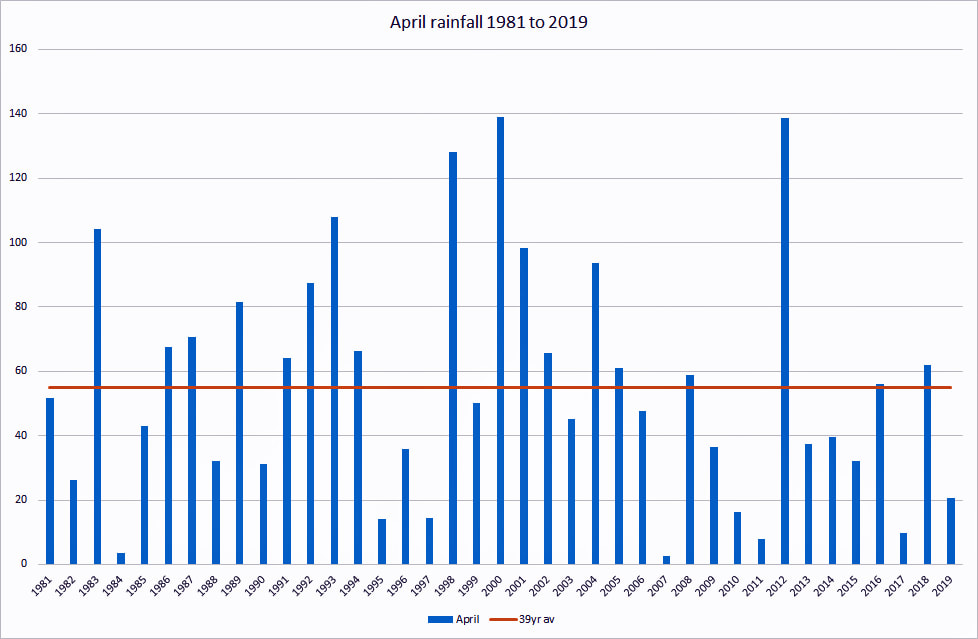
Another dry month with a mere 20.6mm rainfall over 11 days with most of those days having such a small amount that there was little to no chance of the rain going into the ground. April has shown itself to be very variable as regards rainfall with 21 of the past 39 years with below average precipitation and a massive variation from just 2.6 to 139mm. 2018 was a deal wetter with above average rainfall. The middle of the month was very pleasantly warm with 6 consecutive days above 20°; this coincided with the Easter weekend but does not look to be a forerunner for the early May Bank holiday! Overall this April was comparable with April 2018 in terms of temperatures but there was one morning when the minimum actually dipped to a minus figure. Hopefully we can now look forward to consistently warmer weather and maybe some much needed rain----but overnight please!
May
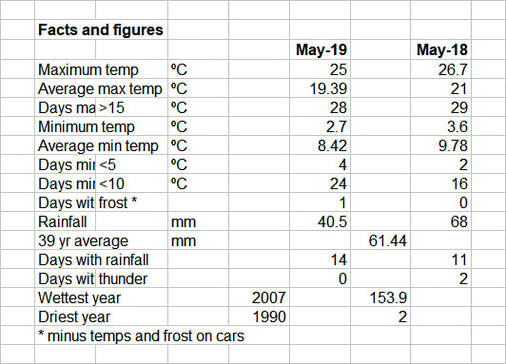
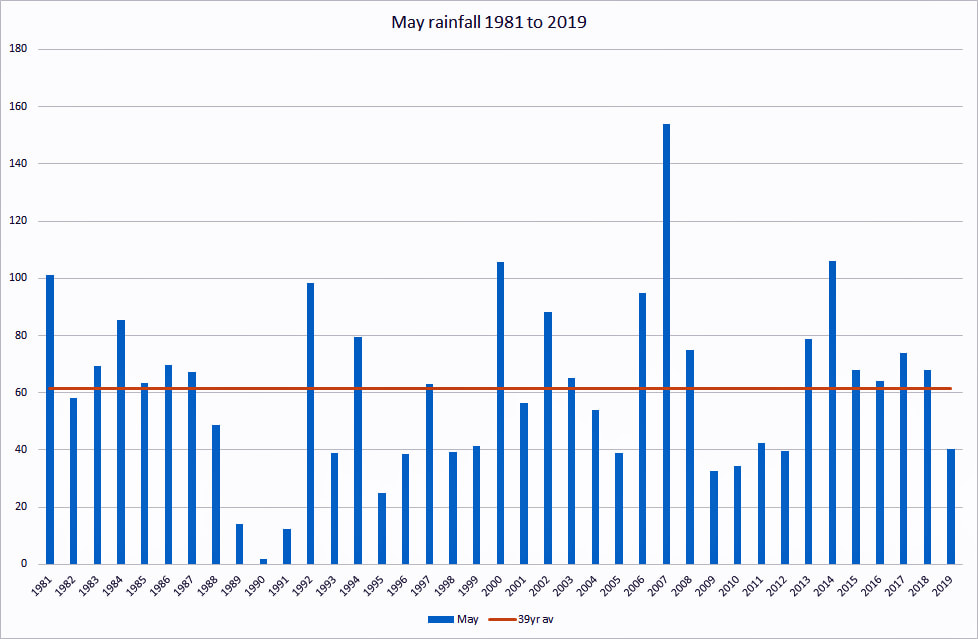
It was quite an average month for May with reasonable rainfall if somewhat below the 39 year average.
The maximum temperature was 25° compared with 26.7° last year and the minimum was 2.7° compared with 3.6°.
The second half of May was mainly dry and the temperatures rather pleasant for the time of the year. Most of the rain came on 3 days (7,8, and 9th) with a total of 27.8mm out of 40.5mm. 15 days were sunny although there was a frost (car) on just one morning.
The grass grew in spurts depending on the rainfall and the wheat at last looks to be getting going.
The Misbourne is still low.
June
I have been changing the position of my temperature and humidity sensor. It was on the north facing wall of the house and would get the early morning sun (when there was any) an possibly therefore give a false high reading. I have now moved it so that it is always in shade; the readings will be more representative of actual air temperatures-most importantly I can still receive the radio signal to the base unit.
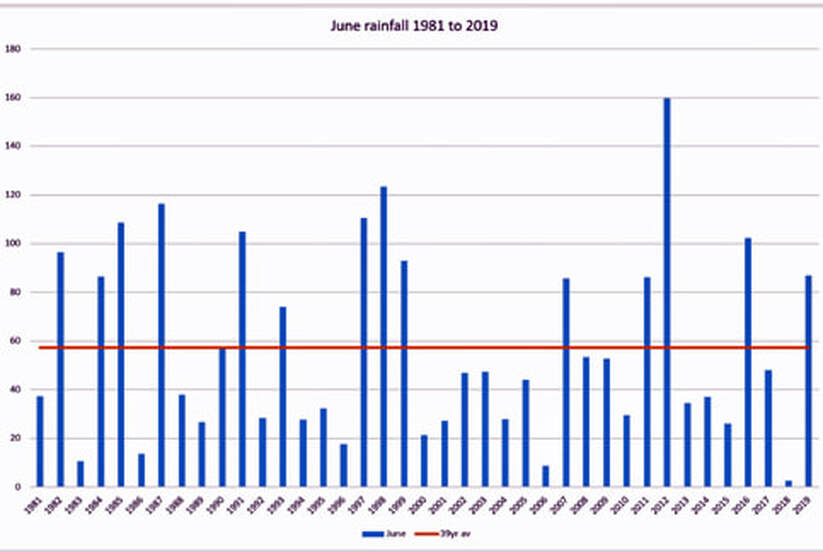
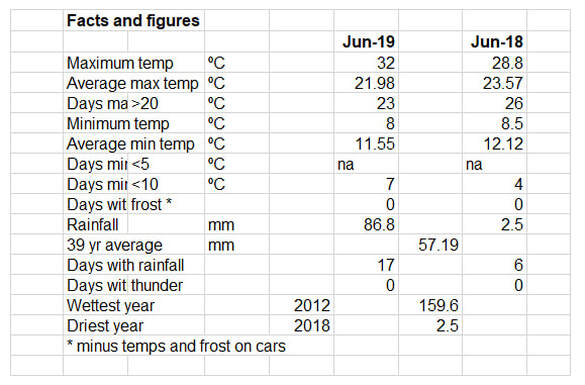
June was another month of contrasts; the first half was wet and the second mainly dry and quite warm The maximum temperature of 32°C on the last Saturday I am confident was accurate. Temperature wise, this June was similar to 2018 but rainfall last year was the lowest in my 39 years of data. Rainfall was above the 39 year average; 50% of years have been above average.
The wettest June was 2012 with virtually twice what we had this year. I did lay a few turfs at the end of the month so high temperature and no rain was on the cards. As I write this—10th—it is 15 days since any rain and Wimbledon hasn’t been delayed at all-so far!
July
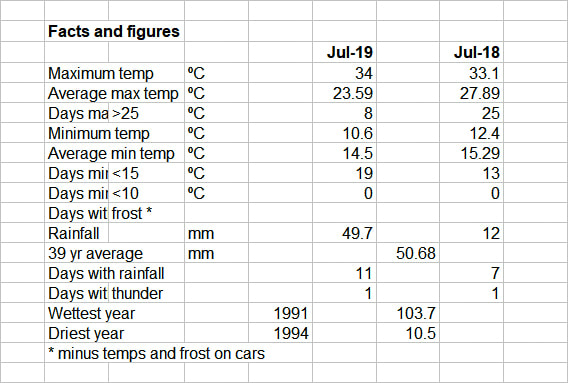
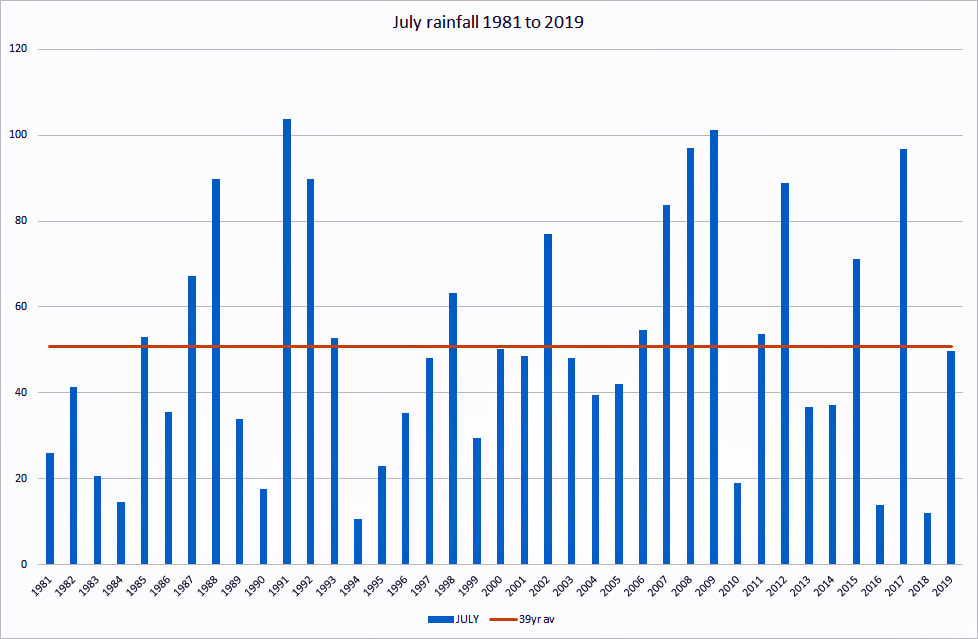
It was a warm, sunny and dry month with most of the rainfall coming over just 3days. Temperatures in some parts of the country broke records and Hyde Heath saw a 34° maximum. Compared with last year temperatures were similar although 2018 had higher averages, rainfall was nearer the 39 year average whereas last year was very low. At the end of the month, the weather became more unsettled and we lost most of the sunshine; school holidays—what do you expect!
August
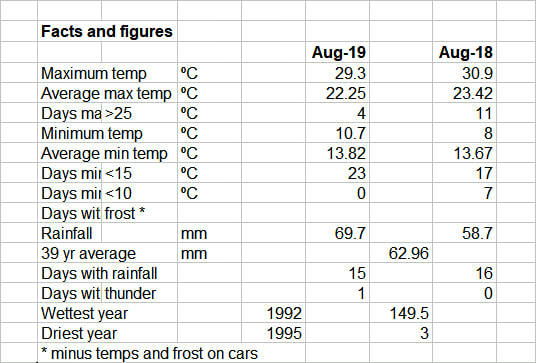
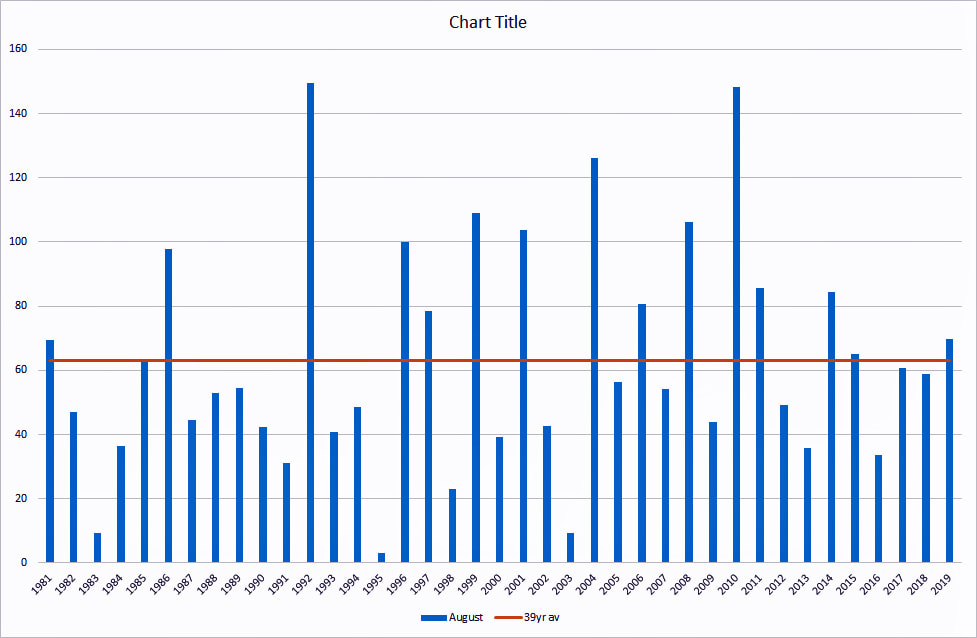
For me the most notable feature of August was the torrential downpour on Friday 9th when 16.8mm fell in just 30 minutes; glad we live on a hill! Overall the month was fairly typical August; the schools were on holiday so expect some cloud and rain—which is what we had. There was rain to some extent at least on 15 days although 42 of the 70 mm fell on just 5 days. The temperatures were similar to last August with that very warm few days at the end but the rest being average. It is easy to forget that by the end of August the sun is well on its way back to the equator. The ground id still very hard and although the harvest has largely been gathered, the soil could do with some steady rain---preferably overnight!
September
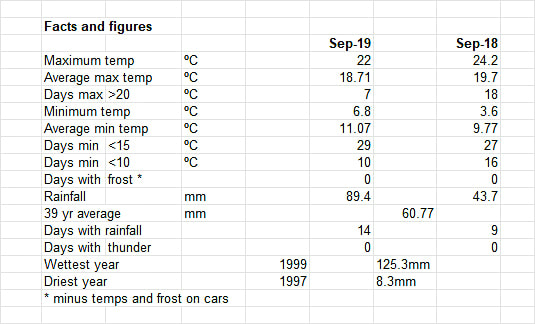
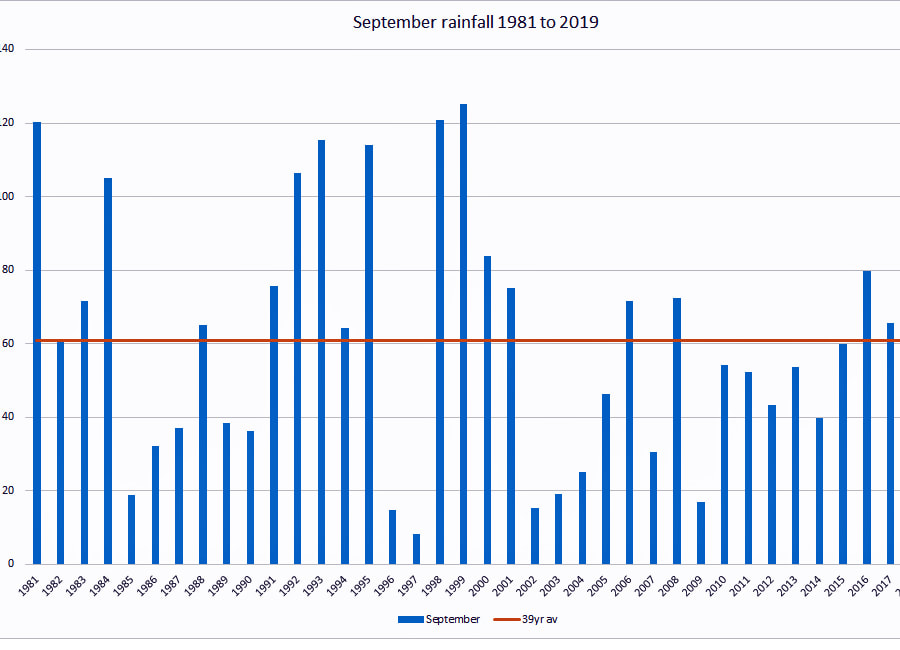
I thought that we would be having a very dry month. The days up until 22nd totalled just 9.2mm. Then the heavens opened and the last 8 days poured 80mm on “us”. It shows the way nature has a habit of evening things out. The rainfall was above the 39 year average of 60.77 mm but looking at the graph I would say that the trend is for a drier September—if I could find the trend line formula I would add it! Overall a slightly cooler month than last year during the day and somewhat warmer overnight. Making any predictions is very unwise; the Met Office try as do some of the newspapers and they rarely get it right. Despite the reports of flooding today (1st October) as far as Hyde Heath is concerned this has been a dryish year so far but who knows what the last 3 months will bring.
October
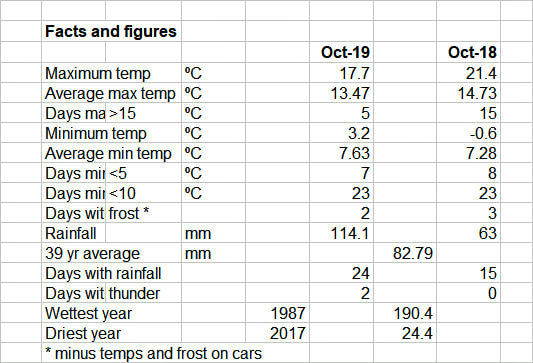
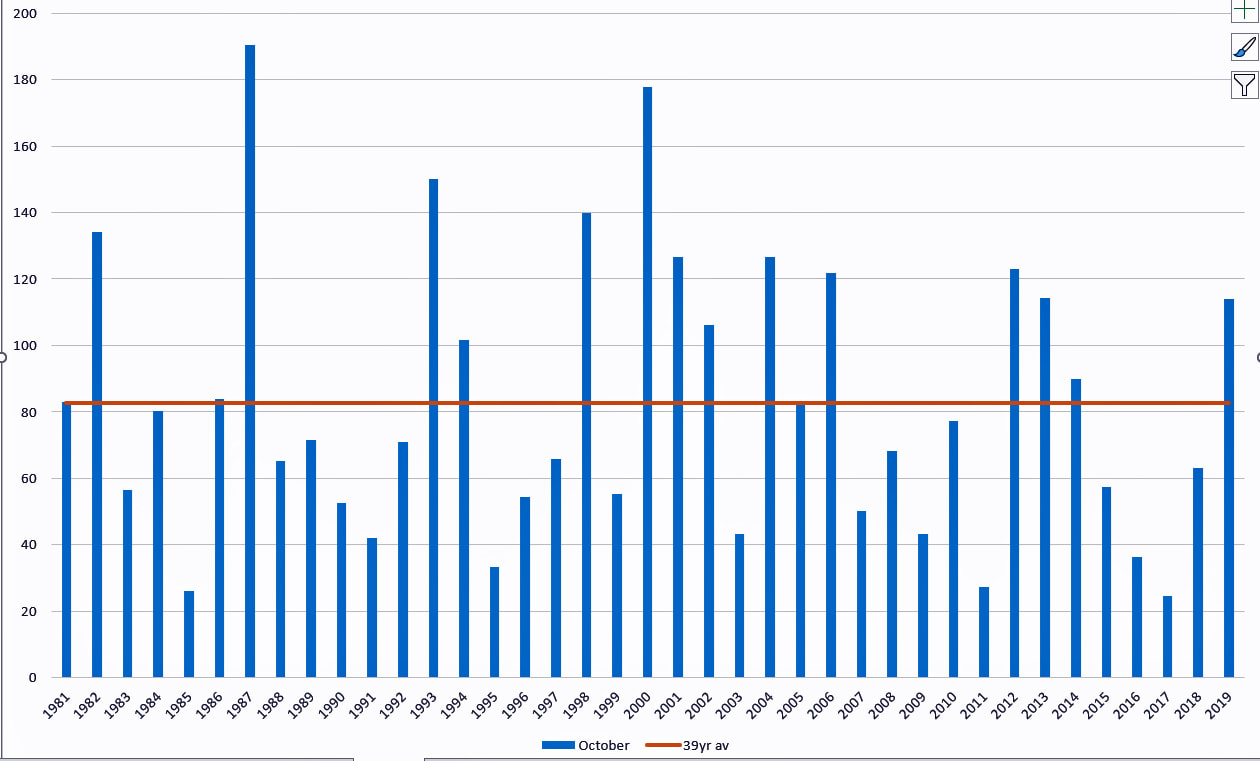
October was a mild month with a lot of rain. At one stage it looked as though there would be only 2 days with no rainfall but a drier spell towards the end of the month saw that figure increase to 7. At 114.1mm rainfall this was some 40% above the 39 year average but nowhere near the 1987 figure of 190.4mm. There were 5 particularly wet days with 68 mm of rain. However compared with areas to the far west of us we got off really lightly. As one would expect for October, the temperatures gradually slipped from a high of 17.7°C on the first day to around 10° by the end of the month. Frost was evident on the car roofs on 2 days, one of which certainly saw a frost on the grass on the Common. As seems to be the case now, the leaves are sticking rather stubbornly to the trees but high winds are forecast as I write this report so things may change.
November
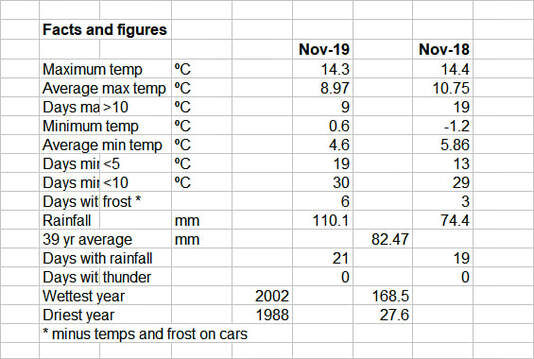
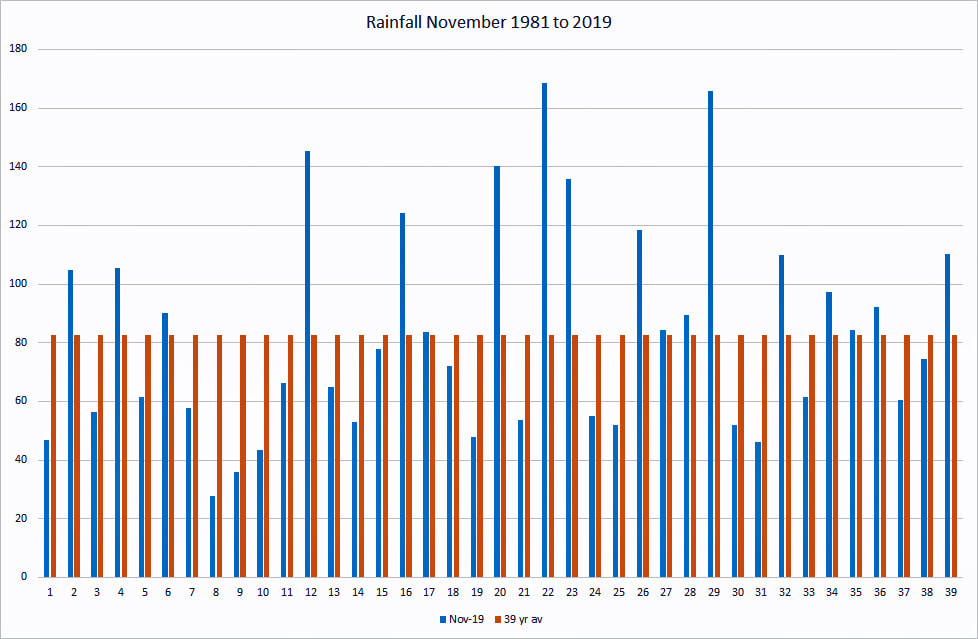
Another wet month with above average rainfall spread pretty much through the whole period. There were 4 days in the last week when there was no sign of the sun and the relative humidity remained at 98%. This is rather unusual and is a real indication of just how damp (and miserable) it was. There were very few “sunny” days and I found it quite uplifting when there were a couple of days when the sky was clear and seemed to go up for ever. We had a number of frosts; not severe but enough to slow you down in order to scrape the car windows. Temperature wise, it was not dissimilar from last year; some mild days and not really cold at all—of course the high humidity makes it feel colder. We have had more rainfall in the 11 months of this year than in the full 12 months of both 2018 and 2017 which is quite surprising as some of the earlier months were well below average. December has started dry---we shall see.
December
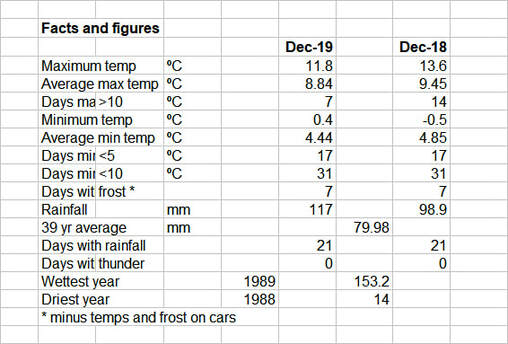
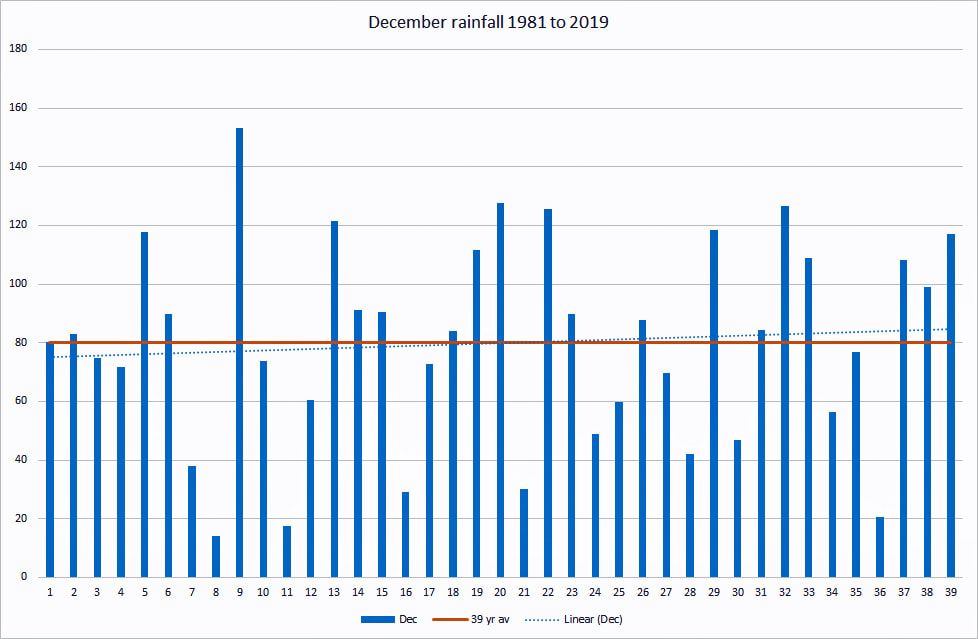
It was a wet month adding to the rainfall from the previous 3 months all of which had been above the 39 year average. However the ground had become very hard over the summer and it is likely that some of the earlier rain will have run off rather than penetrate to the water table. The next few months will determine whether the aquifers are properly replenished or whether the threatened hose pipe ban comes into force. At 117mm rainfall was nearly 50% higher than average; the wettest day, 12th, saw 23.3mm (nearly an inch in old language---I wonder how much we will return to imperial measures once we are out of EU). This December was also wetter than last year. From a temperature point of view the maxima were significantly lower than last year but December 2018 had slightly colder minima. In both years there were 7 days of scraping ice from the car!
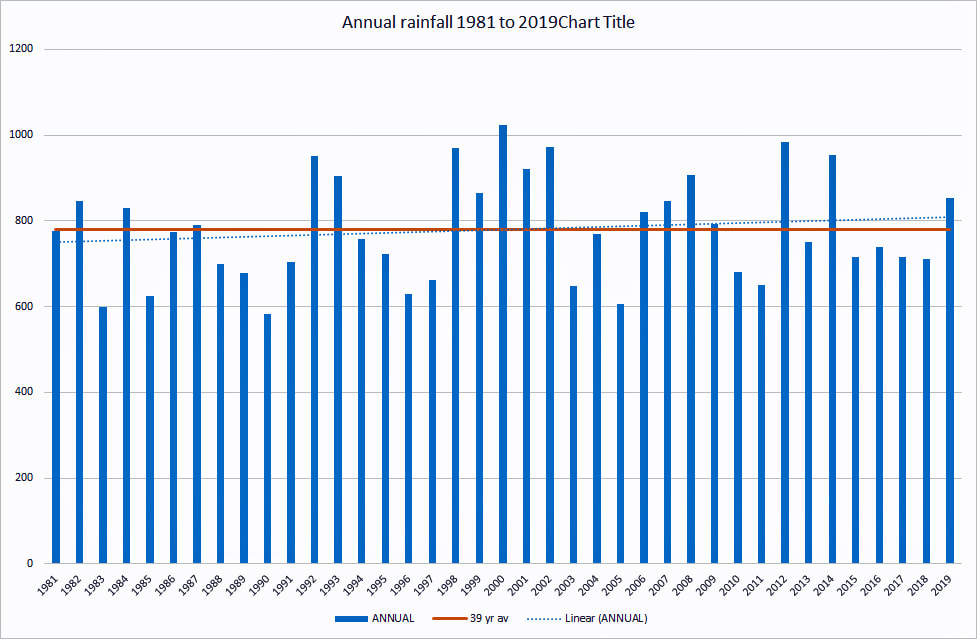
The full year saw greater than average rainfall by some 10% but still a long way below 2000 when 1022mm fell compared with a mere 852mm this year. I have included a trend line on both rainfall charts—a slight upward angle but probably not significant and 39 years is possibly not sufficient data.
The full year saw greater than average rainfall by some 10% but still a long way below 2000 when 1022mm fell compared with a mere 852mm this year. I have included a trend line on both rainfall charts—a slight upward angle but probably not significant and 39 years is possibly not sufficient data.

