Hyde Heath Weather reports by Gary Beynon from his own garden observations and measurements
January February March April May June July August September October November December
January February March April May June July August September October November December
January
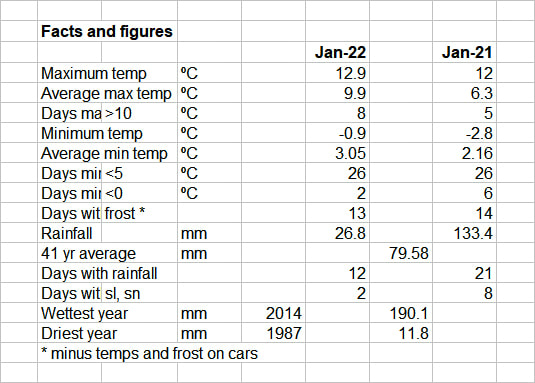
January was a relatively dry month, mild during the day, a number of frosts/car frost overnight, just 2 days with snow flurries and an equal mix of bright and cloudy days.
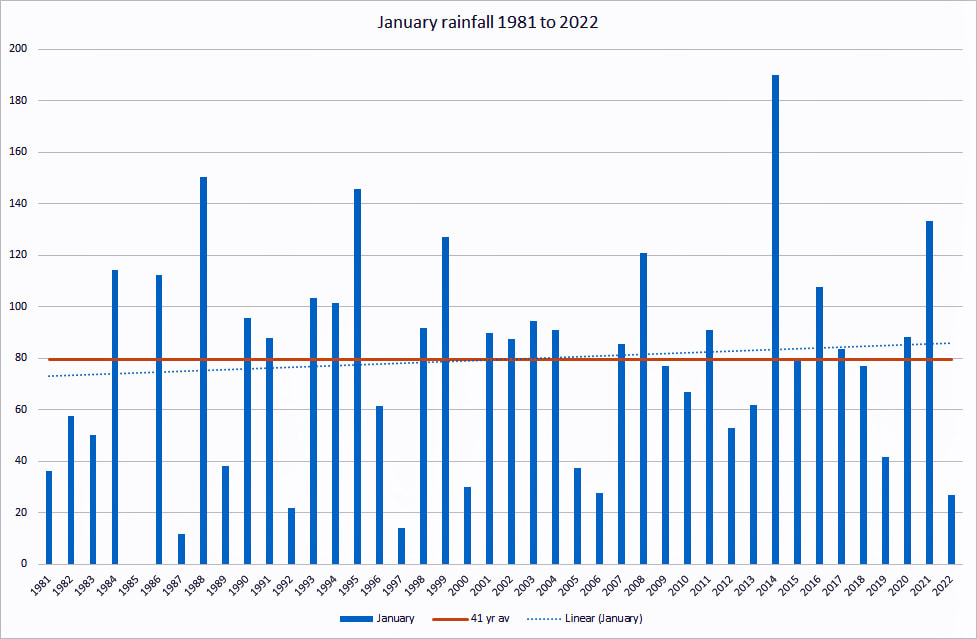
The pressure was high for most of the month with 14 days higher than 1030 Mb. At just 26.8mm of rain over 12 days it was dry compared with last year with 133 mm and a 41 year average of 79.58 mm.
The trend for January is marginally increasing but this is against a background of very variable amounts year on year. Last January was colder on average overnight but not especially so; frosts were similar.
A somewhat unremarkable month for one that I suspect we all assume will be really wintery even though the data doesn’t support that stance. The Met Office have said that this mild weather is going to bring the flowers out some 2 weeks earlier; looking at snowdrops and crocus plants they could well be right!
February
A month that we will all remember for the two named storms, Eunice and Franklin, that came quickly one after the other on 18th and 20th.
I hesitate to say that they were not as bad as predicted as that is a view expressed by someone with very little damage and probably not shared by people who were a lot worse off.
Certainly there were a number of trees down together with cables and, as might have been expected, the railway suffered. Top marks to the people who cleared the obstructions so quickly.
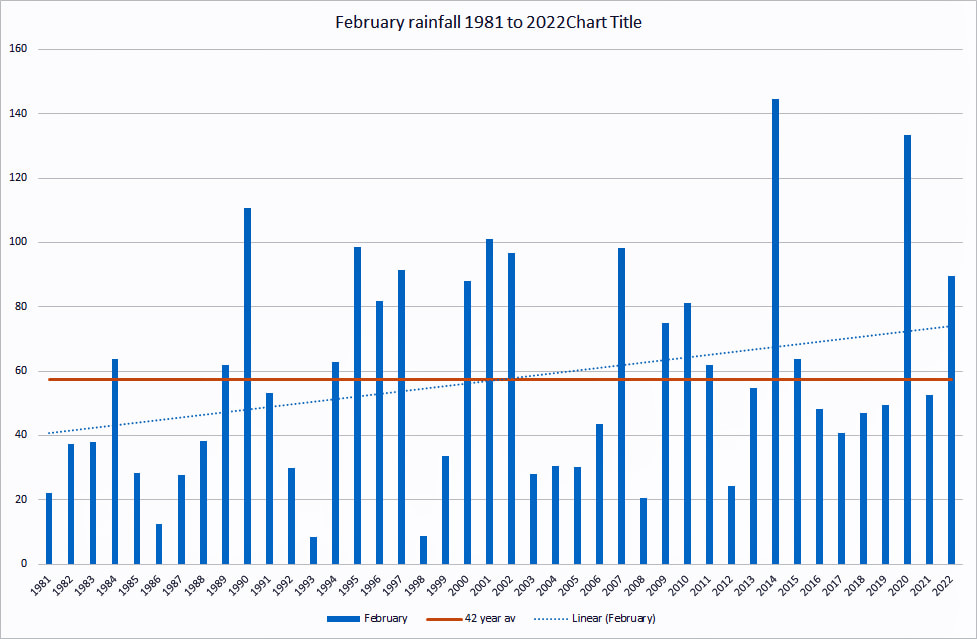
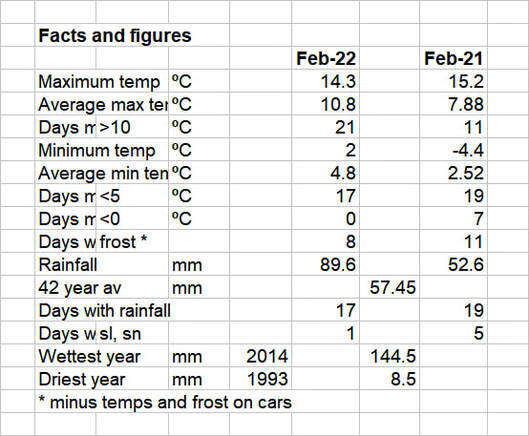
After a dry January, February started to make up with nearly 90 mm of rainfall spread over 17 days, the wettest giving 20.6 mm.
February has seen wide variations in rainfall from as little as 8 mm back in 1993 to a huge 144 mm in 2014. 18 of the past 42 years have been above average and you will see from the linear trend line on the graph that February is getting a good deal wetter.
The temperatures were quite mild with a maximum of 14.3° and a minimum of 2.0°. There was frost on cars over 8 mornings. Compared with last year, this February was not that different on average but 2021 saw 7 consecutive days with minimum temperatures below zero and a low of -4.4°.
March
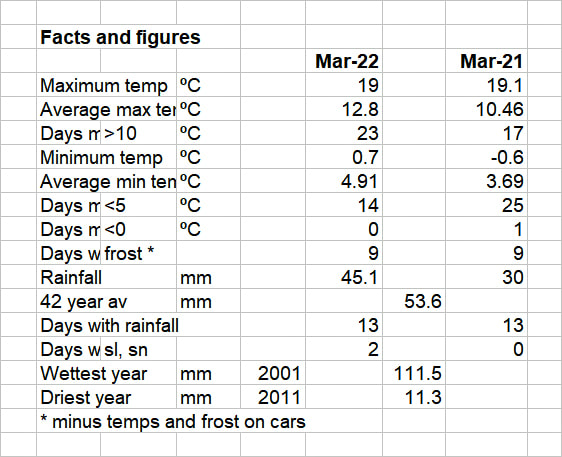
What will we remember about March; the very mild days or the snow showers at the end? As time goes on we probably won’t remember it at all!
March was a mild month but with a sting in the tail. Temperatures over the middle period were warm but dropped dramatically for the last 3 days. However overnight temperatures were often down in the low single figures with frost evident on 9 mornings.
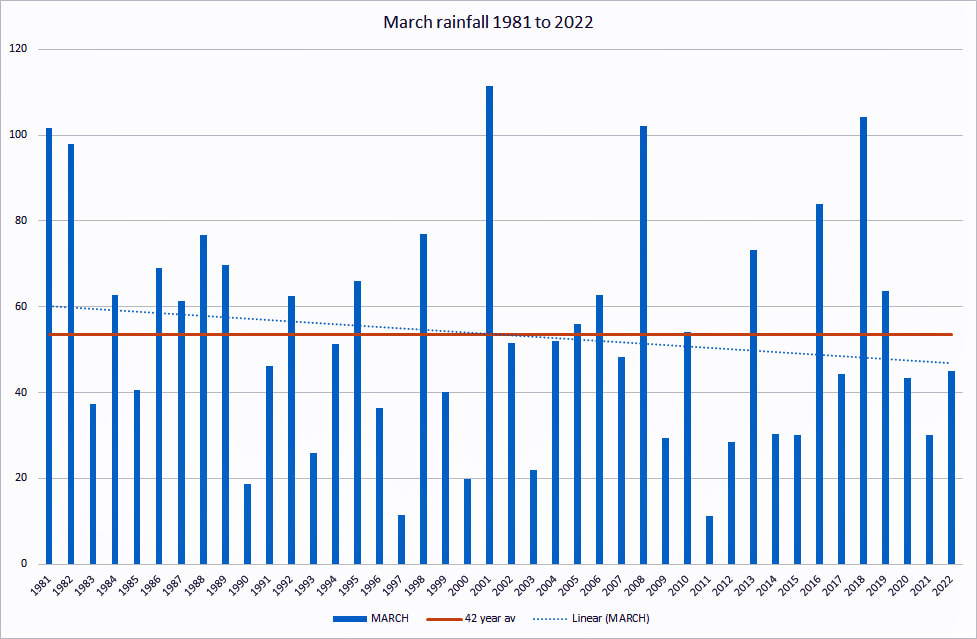
It was a dry month with rainfall below average although March is not a wet month with average rainfall of 53.6mm and a trend decreasing.
This year March compares not that differently from 2021 with same maximum and similar minimum temperatures.
The average figures however suggest that this March was warmer overall perhaps reflected in the way in which the grass is growing and the flowers and blossom has been magnificent.
Over the winter months (October to March) rainfall—which is when the aquifers are replenished—was below average and well below some the wettest times we have had over the past 41 years. Please see the chart that is with this report.
April
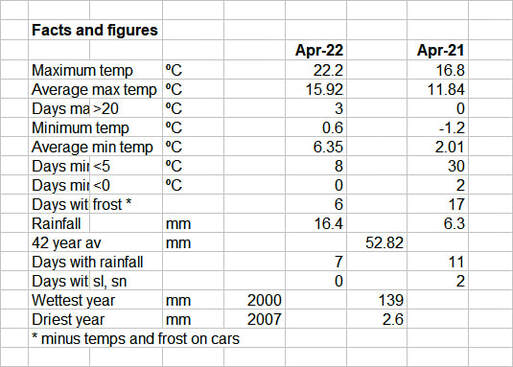
Rather a strange month which we may remember for the high temperatures in the first half and the very heavy rain—with thunder and the inevitable power cuts—in the last 10 days.
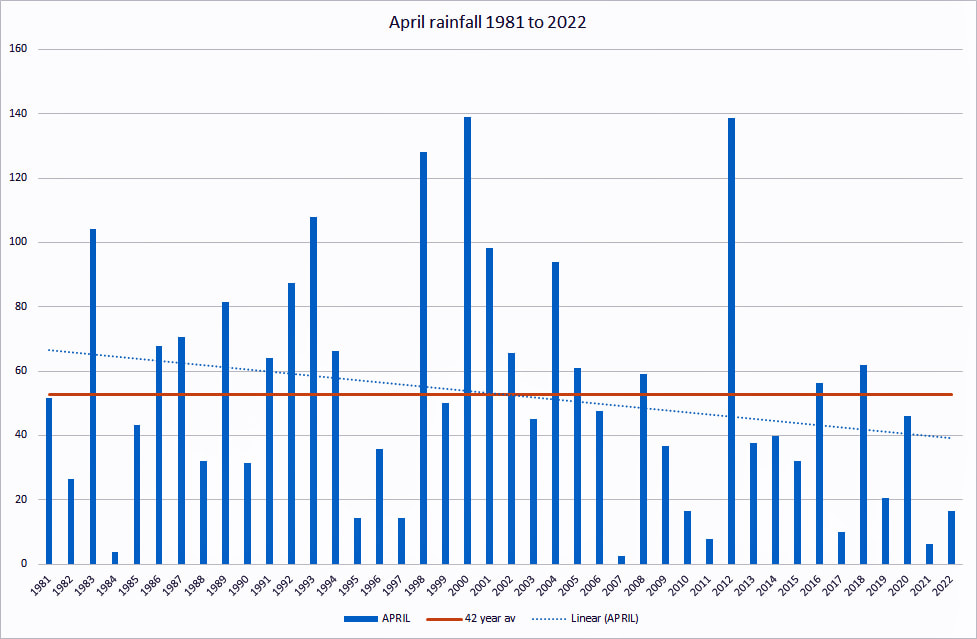
The wettest day with 26mm was the 28th but 5 other days all had between10.2 and 17.3mm so little wonder that the month total was 130.3mm. August over the years has been something of a mixture with either a lot of rain or reasonably dry.
The 40 year average is 64.65mm and the trend is for it to get wetter but with such large variations I am not sure that this is that meaningful. We always hope that August will be sunny and warm for the school holidays but experience shows that it often disappoints.
Compared with last year this August was on average the same maximum temperature wise but had warmer nights. Rainfall was virtually double compared with last year but the same level of wet days.
Apparently the wheat harvest has been poor due to a combination of the wrong weather at crucial times and then too much wet when harvesting was taking place.
My runner beans have certainly suffered from not enough water when it was needed to give a good crop but apples are some 2 weeks ahead of the norm because the weather was right for them.
May
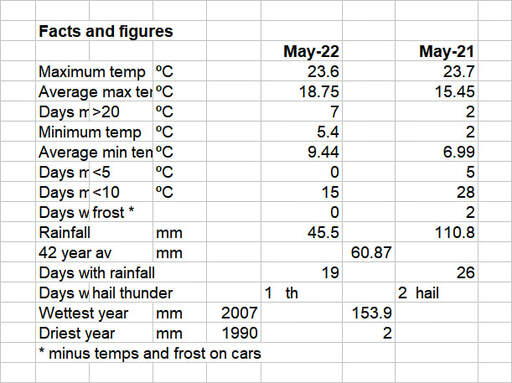
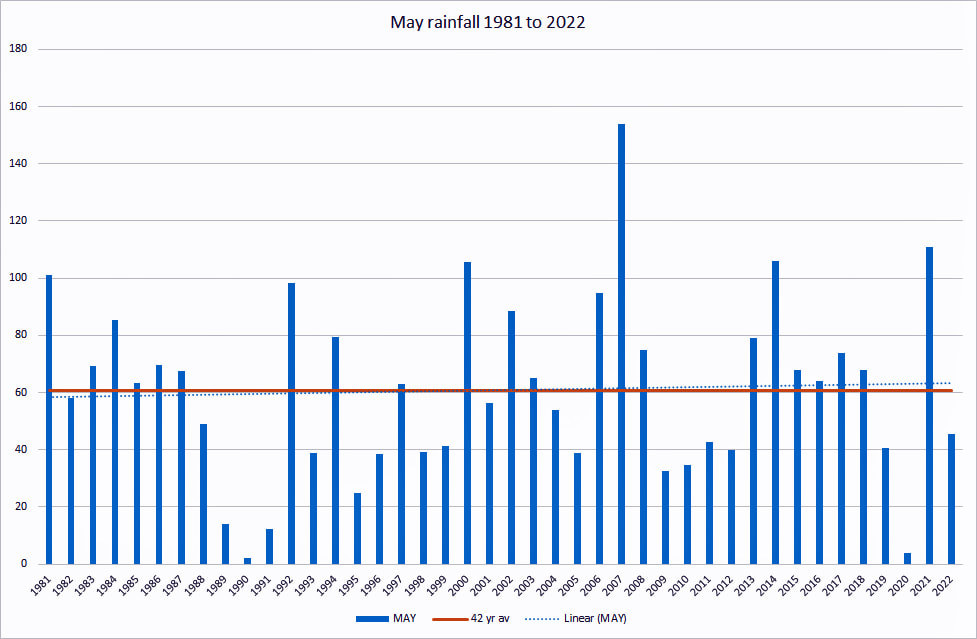
May made the grass grow or, more accurately, the rain did.
It was not a particularly wet month with rainfall well below the 42 year average but with 19 days with some precipitation it was enough to keep the surface wet enough for the grass and cereal crops to grow well.
Over the 42 years of my records, the rainfall trend is virtually flat but with dramatic variations from 2007 with 153mm to 1990 with only 2mm. Temperatures were pleasant with an average maximum of 18.75° and 7 days above 20° and a “best day” of 23.6°; this compares with last May of average 15.45°, 2 days above 20° and a high of 23.7°.
Most importantly it was fine for the fête and everyone was able to enjoy the day after such a long break.
June
July
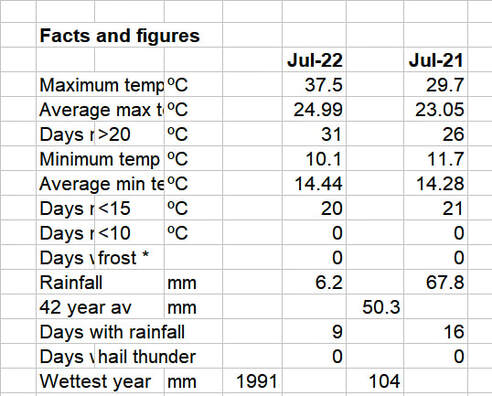
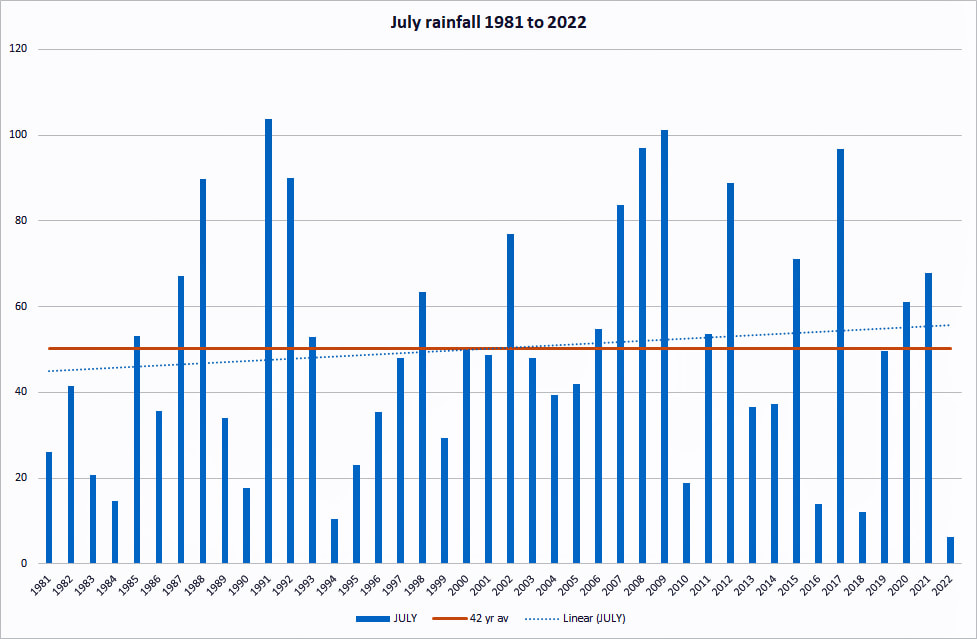
July was a month to remember! The hottest day and the driest month all in one go is something to go down in the record book.
The maximum temperature I recorded was 37.5°; yes it was a LOT hotter than that in the sun but temperatures are recorded in the shade and, ideally in a Stevenson Screen (which I don’t have).
It is also worth remembering that places like airports and the centre of cities/towns act like storage radiators and heat the air even more so temperatures there are always going to be hotter than Hyde Heath.
You only need look at the grass to see how little rain we have had.
Average rainfall in July over the last 42 years has been 50.3mm; just 6.2mm this year. However the trend over that time is increasing.
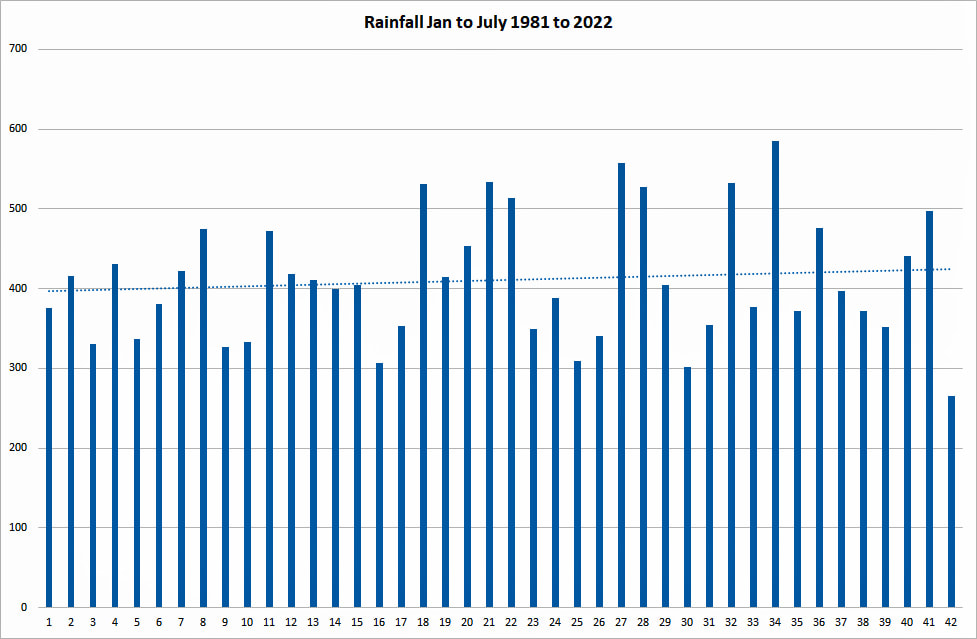
The first 7 months of this year have also been very dry with approx. 275mm compared with a 42 year average of 410mm.
Comparisons with July 2021 are not really meaningful; this year was warmer, drier and different!
August
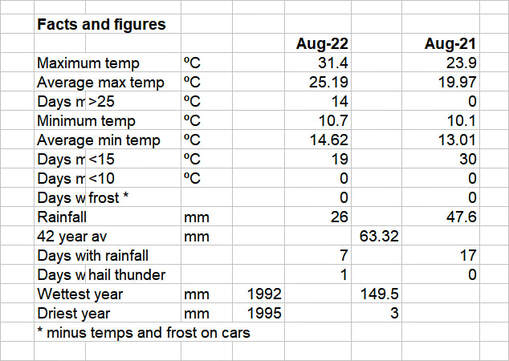
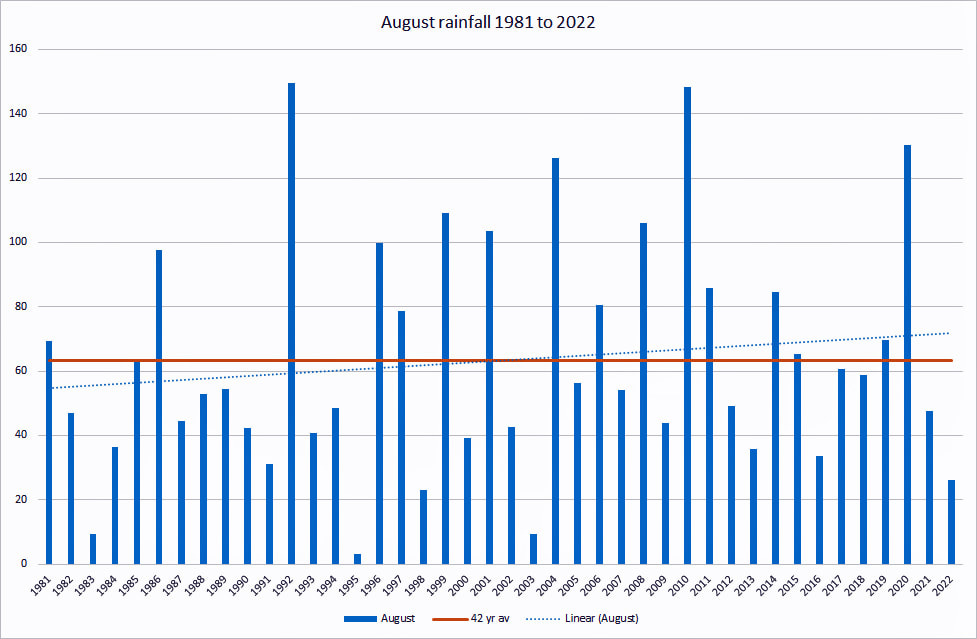
August was dry and hot! Not as hot or dry as July but nevertheless continued the pattern we had seen.
Most of the rain fell on 25th of the month starting around 0500 h and continuing through to 1130 ish with 22.9 mm of the 26 mm month total.
There was a small amount of rain on a further 5 days but it evaporated as soon as it hit the surface!
There were a lot of sunny days; 15 days when I noted either “sunny” or “mostly sunny”.
Temperatures were always above 20° in the day with 5 days above 30°, and overnight the minimum never dropped below 10°.
Despite the 6th month in a row with rainfall below—well below—the 42 year average, we have so far escaped a hosepipe ban.
The Affinity Water website shows that the groundwater aquifers are below where they should be but not dramatically so currently; and HS2 are still washing down their road at the Barley Mow!
August 2021 was rather different. More rain but still below average, and much lower temperatures. Surprisingly the linear trend on rainfall is showing a small increase over the 42 year period.
September
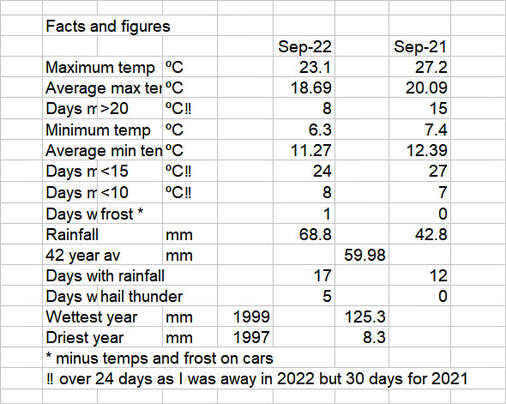
September was a somewhat mixed month with a wet first 2 weeks and a last day with 12mm of rain, and fairly pleasant weather in between.
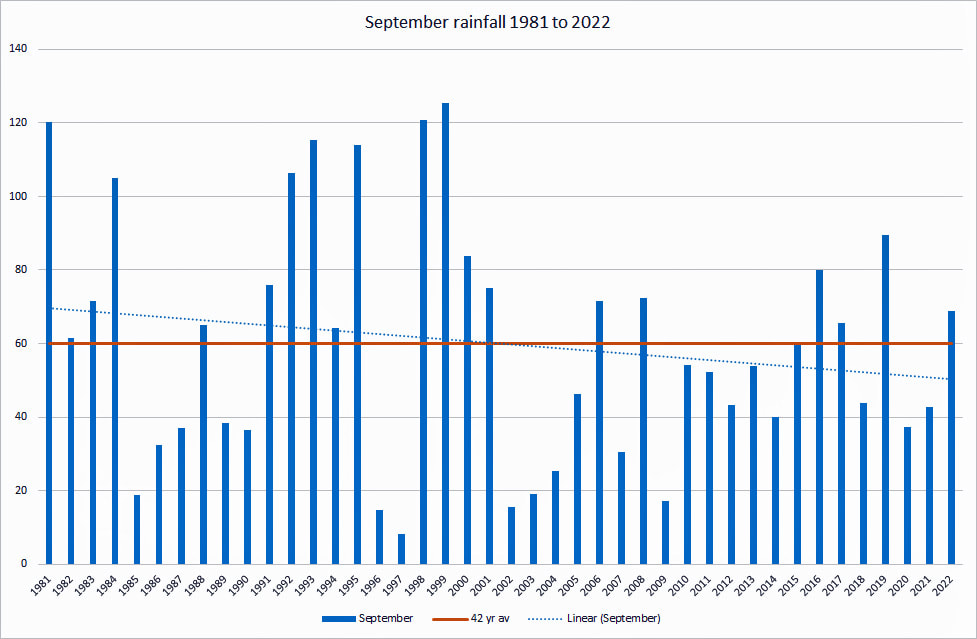
At last I can report that the rainfall was above the 42 year average but maybe of significance is that the linear trend over those years is down from 70mm to 55mm on average.
September shows significant variations in rainfall; maximum was 125mm in 1999 and just 8mm in 1997 with 17 of the 42 years above the average of 60mm.
This September was wetter and cooler than 2021.
There was a marked contrast between the start and end of the month; the first two weeks saw maximum temperatures 20+/- 3° and minimum 13+/- 2°, whereas the last 10 days dropped to approx. 15 and 8° respectively.
Dramatically we saw the grass that had been dead and brown burst into green and growing!
As I write this somewhat later than I meant on 10th October, I would have expected the trees to have lost far more of their leaves given the dry summer—yet to happen.
October
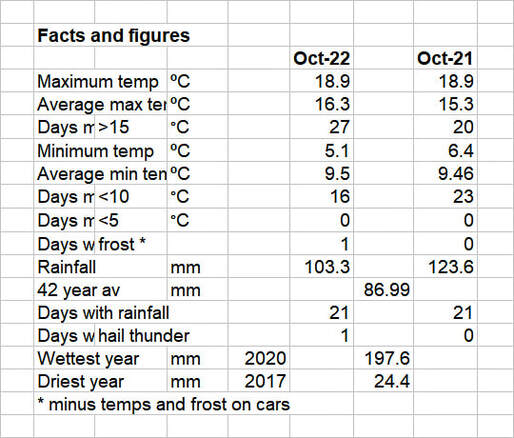
October was a mild and wet month. Very similar in fact to October 2021 with temperatures almost the same and just marginally less rain this year.
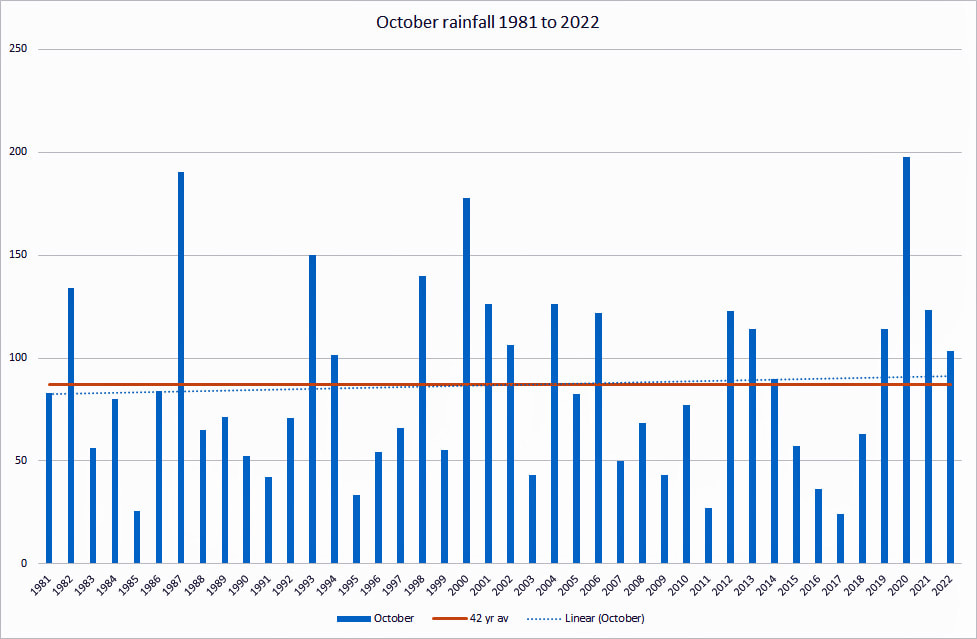
Rainfall was above average and the 42 year trend is showing a slight increase.
Over the 42 years the rainfall has been very variable with a range from 24 to 198mm. Clearly we can’t rely on October for anything.
The Met Office were reporting higher than usual temperatures but nothing approaching the 29° back in 2011 on October 1st in Kent.
The Hyde Heath maximum that October was 24.3°---WOW. I thought that the leaves were staying on the trees for a long time; then a great mass fell when the rain set in during the 3rd week.
The grass has recovered and the flowers (my dahlias in particular) have continued to bloom throughout the month.
The month could be split into 2 parts; the first 15 days were warm and mostly dry whereas the last 16 days were much wetter although still warm. In fact the last 2 weeks saw some rain at least every day---and it has continued into the first few days of November.
November
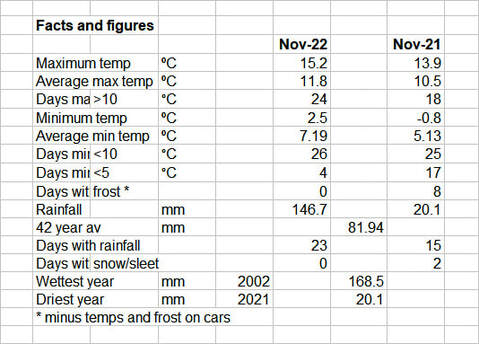
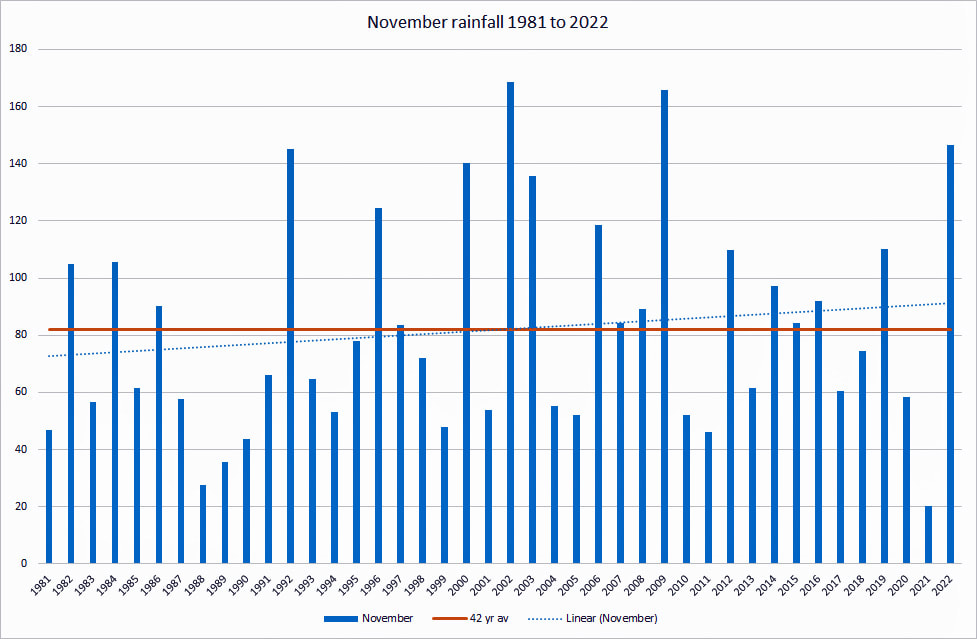
It was a mild and WET month; we now seem to be making up for all the dry weather that we had earlier in the year. At 147mm of rain over 23 days this November was pretty wet although the ground seems to have soaked it up well.
This was well above the 42 year average rainfall and over those years there has been a significant increasing trend up from 74 to 90 mm.
Last year was the driest at just 20 mm so somewhat variable! This year was also significantly warmer than last; average temperatures over a degree warmer and no frosts. You may remember that we actually had snow last year, nothing could be further away this year.
There were many days when the relative humidity (the amount of moisture in the air) peaked at 95% (again the maximum my instrument records) and a number when the 95% figure was maintained over the 24 hour period.
This gave us a characteristic cloudy dull day when it really didn’t get light properly—a disaster for anyone with solar panels.
The last few days saw a drop in temperatures which has continued as we move into December. Perhaps the leaves will finally come off the trees
December
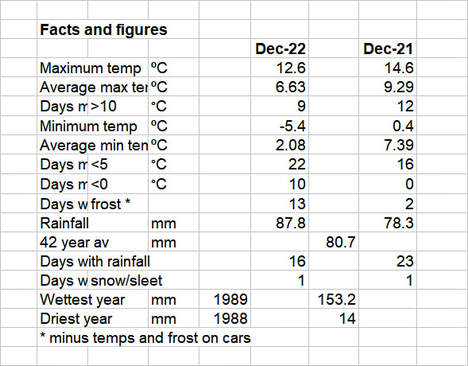
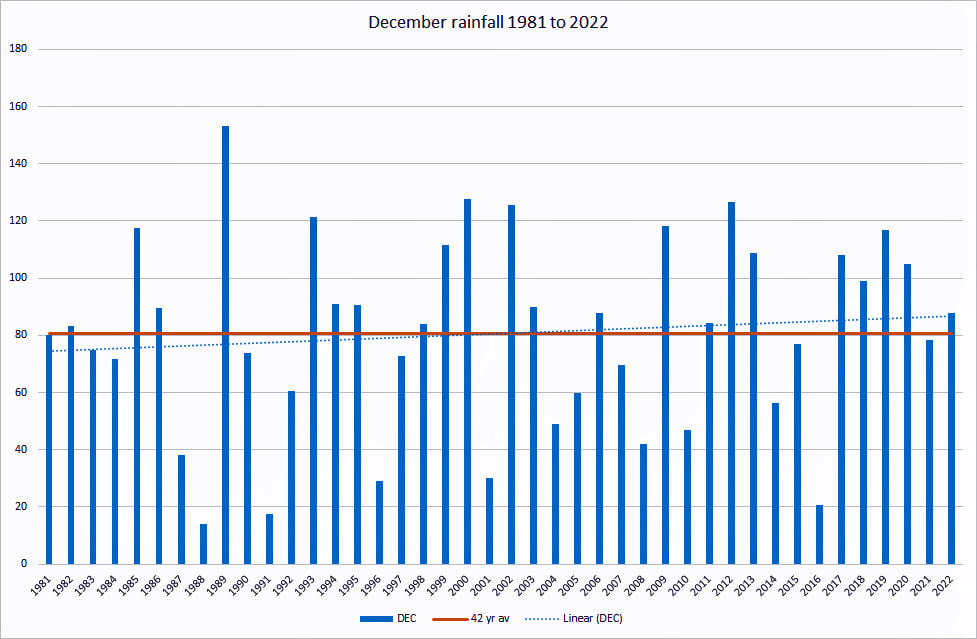
December again turned out to be a month of two halves; the first two weeks were dry and cold, the last two milder and wetter.
It is a long time since we have had a sustained period when the minimum temperatures overnight have been below zero; in December there were 11 consecutive nights with a -5.2° on15th.
The 18th saw a jump from a max of 3.8° to 11.6° and these higher temperatures were maintained through the Christmas period.
Most of the rainfall also occurred in the last two weeks even though we had that fall of snow on the 11th which then hung around.
Compared with December 2021, this last month was colder, marginally wetter but overall brighter.

