Hyde Heath Weather reports by Gary Beynon from his own garden observations and measurements
January February March April May June July August September October November December
January February March April May June July August September October November December
January
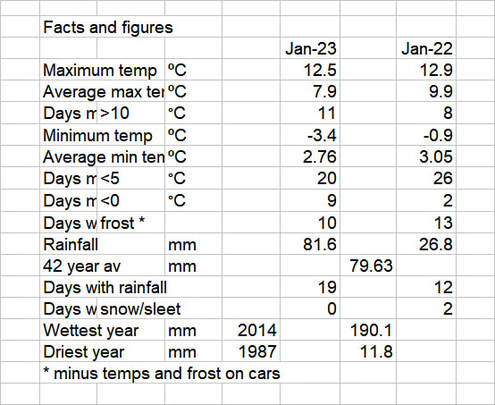
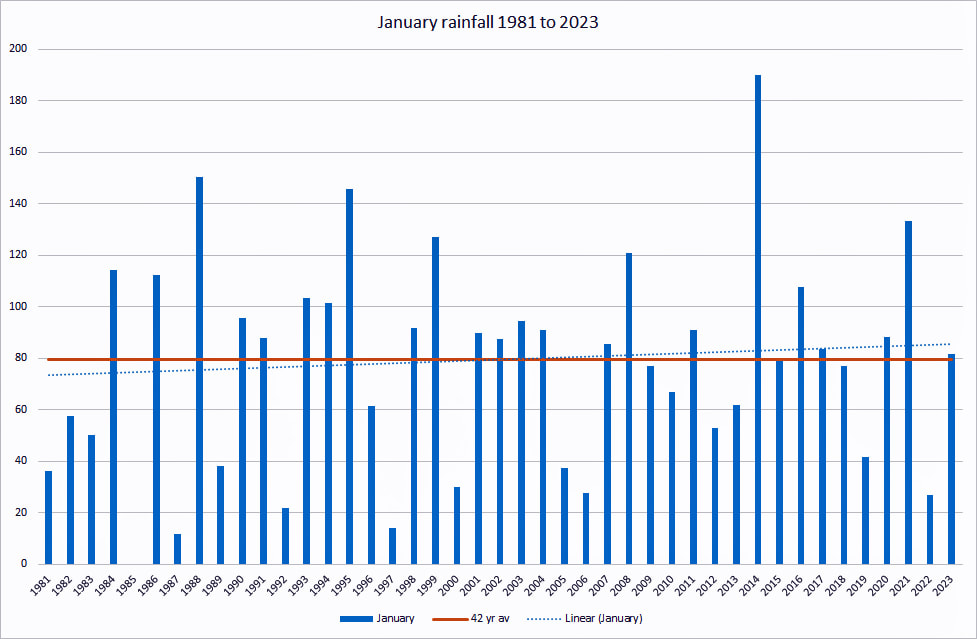
It was a mild and wet January to start with a distinctly cold snap part way through and finishing somewhat milder again at the end.
More recently it has been unusual to see a sustained period of hard frosts; the third week of January gave us that with temperatures as low as minus 3.4° overnight.
It was a penetrating frost onto saturated ground making the surface hard and in many places rutted and difficult to walk on.
Almost as quickly as the cold came, it went although the strong breeze made it feel that bit chillier.
The first 2 weeks were wet with 95% of the month’s rainfall and as the end of December had also been wet, the ground was saturated as evidenced by the water on the roads and overflowing ditches.
Compared with last year, this January was colder and wetter.
February
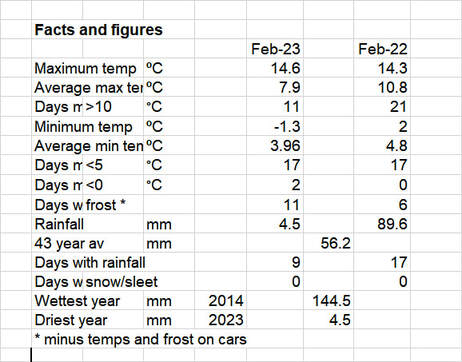
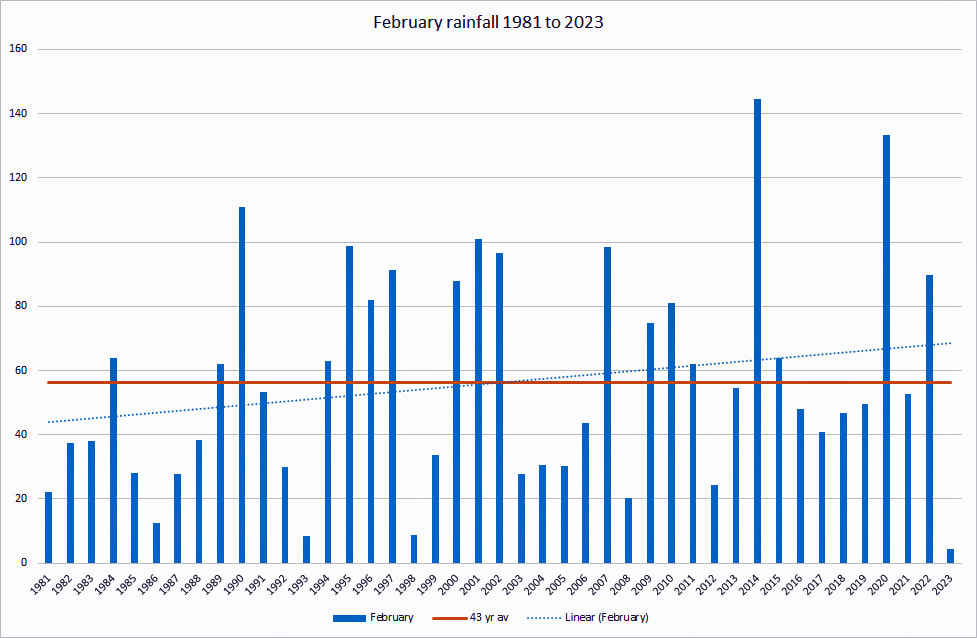
The Met Office reported that this February was the driest for 30 years; as far as Hyde Heath is concerned it is the driest in the last 43 years(for as long as I have been keeping records).
Our next driest was in 1993 at 8.5mm followed by 1986 at 12.4mm so this last month at a mere 4.5mm is going to take some beating. The big danger I suspect is that we didn’t water some of the pots that we should have; I think I have killed a couple of my potted shrubs.
Our wettest February was in 2014 with 144.5 mm so quite a contrast from least to most; perhaps interestingly the trend over the last 43 years is actually upwards from 45 to 70 mm.
Compared with last year it was a marginally colder month on average but nevertheless mild for this time of the year. Somewhat at random, looking at 2013, we had 16 days with frost, 8 days of snow/sleet and a much lower average minimum temperature.
We do seem to be experiencing a milder winter season at the moment but all these things appear to be cyclical and it wouldn’t be a surprise if the near future reverts to more typical weather.
A milder February does not guarantee that the winter is over despite the fact that we have started the meteorological spring. We are apparently expecting a bitter period at the start of March. The one fact about the weather is that it is unpredictable.
March
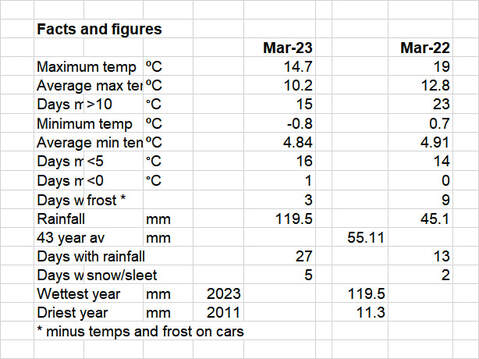
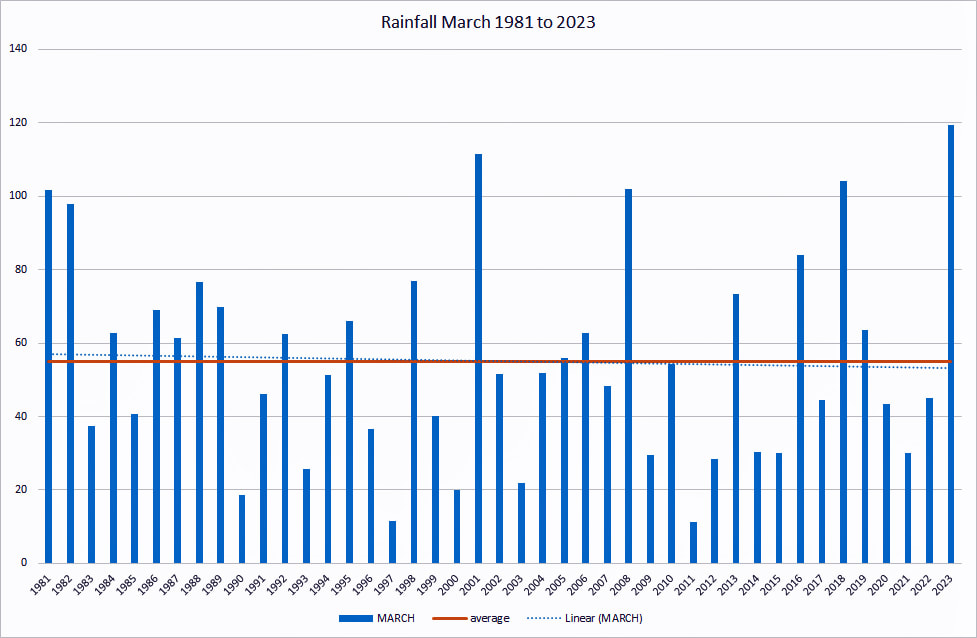
The Met Office reported that it was the wettest March in 40 years; agreed! In fact the wettest that I have recorded in the years since 1981 when my records began.
At nearly 120mm over 27 days it was a soggy old month and even gave us snow and sleet on 5 of those days.
The average for March is only 55mm so this year saw over twice that amount. However high rainfall in March is not unusual but the month has shown big variations over the years. Comparted with March 2022 shows a large difference with just 45mm on 13 days.
Last March was warmer during the day with a maximum temperature reaching the dizzy heights of 19° and an average day temperature of 12.8° compared with this years 14.7 and 10.2° respectively.
Overnight the temperatures were quite similar although frost was evident last year on 9 days compared with 3 this year.
What was notable was that February was so dry to be followed by a record March. The rainfall trend for March shows a slight rise.
The winter (October through to March) rainfall figures are interesting; the trend is upwards from 400 mm to approx. 460 mm but again the variation winter to winter is large.
Over the years there have been winters with as little as 240 mm and as much as 750 mm; nothing if not unpredictable!
April
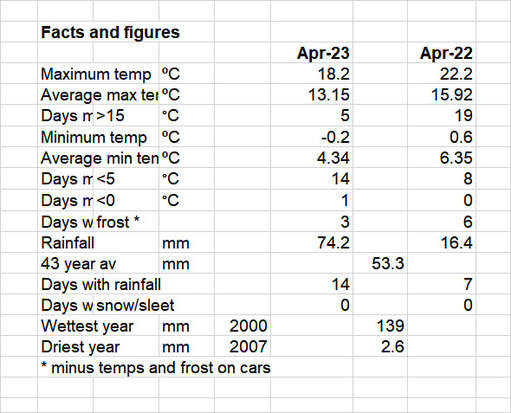
The Met Office reported that this April was one of the coldest on average for some time; the data for Hyde Heath bears this out.
The average day time and night time temperatures were well below those in April last year and, rather randomly, looking at 2014 it was a good deal cooler.
It was evident from the lack of grass growth in the field where we keep our pony that the temperature was not high enough to sustain that growth although the garden grass didn’t seem to follow the same rules!
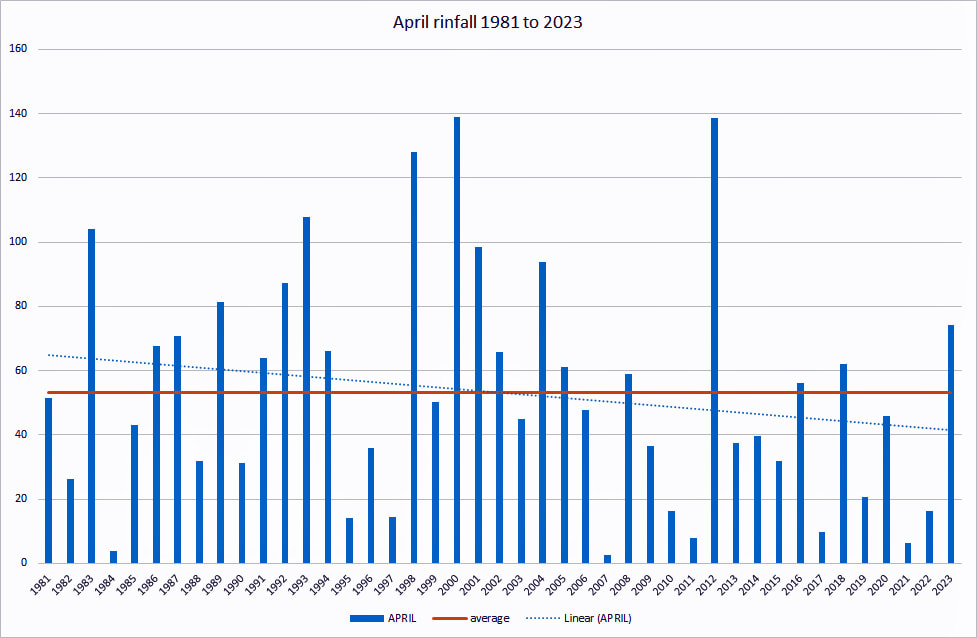
This year was a lot wetter than last with 74mm compared with 16mm in 2022. This year was some 50% above the 43 year average of 53mm but the variation in April over the years is enormous going from 139mm to a low of 2.6mm.
The trend over that period is down from 65mm to 40mm but with such big variations who knows what it will be like next year?
May
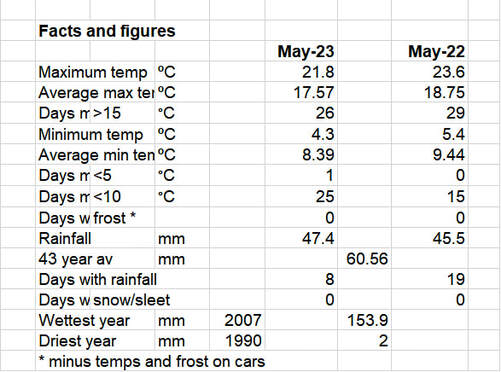
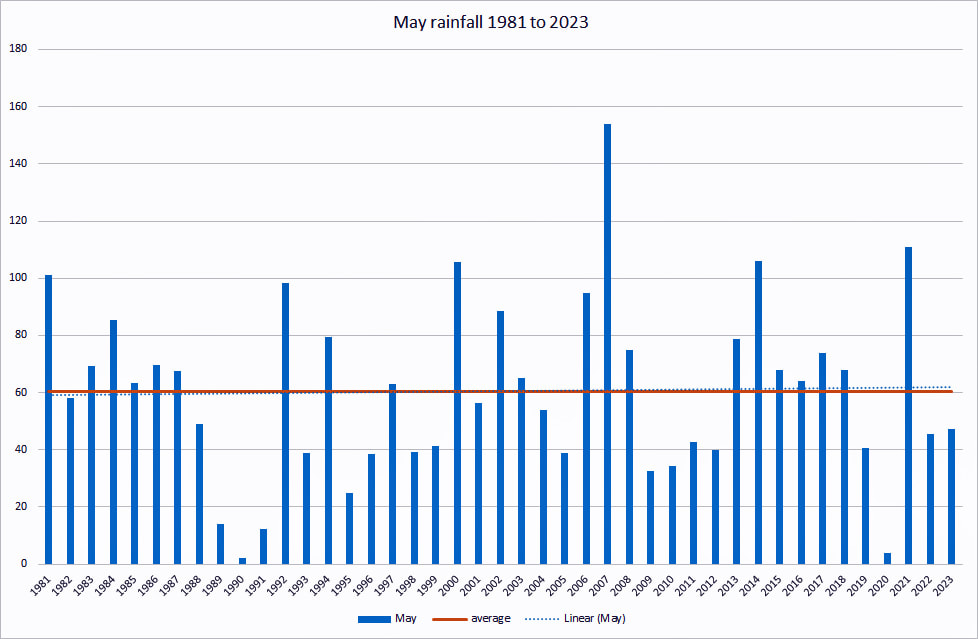
May can best be described as a rather pleasant month with a lot of warm sunny weather at the end and the majority of the rainfall confined to the first 2 weeks.
Most importantly it was fine for the fete and we were able to enjoy a splendid flypast by the Lancaster.
Although it was pleasant, this May was not as warm as 2022 with the maximum temperature lower and, more significantly, the average lower.
Rainfall was very similar with 47.4 and 45.5mm respectively.
This rainfall is below the 43 year average of 60.56mm.
The variation between years is large!, highest being 2007 with 153.9mm compared with 1990 with a mere 2mm.
The trend over the years is however virtually flat.
June
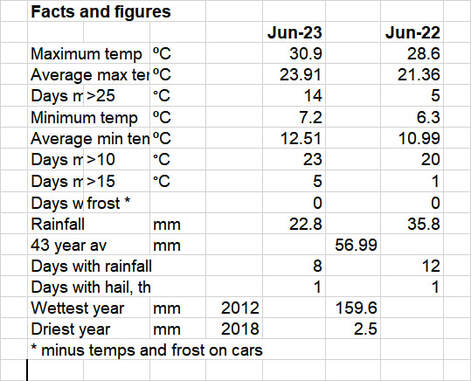
June has been reported as the hottest on record in the UK with previous records in 1884, 1940 and 1976 being exceeded. It was also said to be another indication of global warming.
Although I do not dispute the fact of global warming, I do think that trying to make comparisons with data from 140, 63 and 47 years ago is pushing the boundaries somewhat.
Surely we need to be careful not to use any old data merely to justify something because it is politically current thinking?
Was it a hot June in Hyde Heath? Yes but not dramatically so compared with last year or indeed the last 10 years. Was Hyde Heath typical of the rest of the country?
No here in the South East it was apparently that bit cooler and certainly a lot drier than many parts further West and North.
It was quite a pleasant month with 14 days with a max temp above 25° and predominately sunny on 11 days.
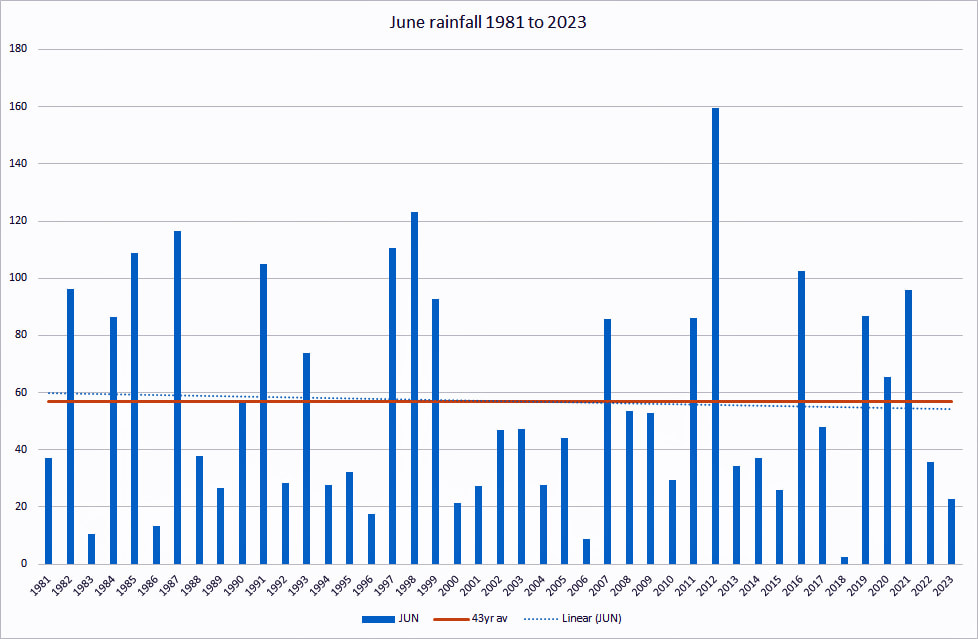
There was not a great deal of rain with just 22.8 mm on 8 days compared with the 43 year average of 56.99 mm( varied from 2012 with 160 mm to 2018 with 2.5 mm).
Over the 43 years the June trend is marginally down but with such large variations that data must be suspect.
July
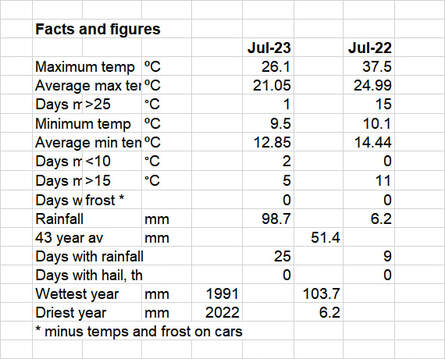
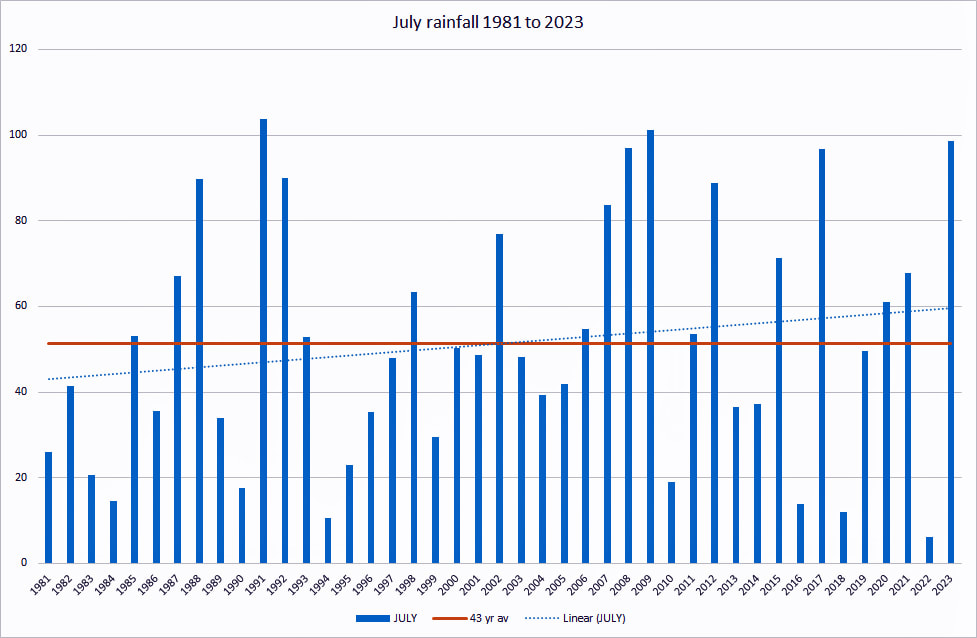
What a contrast between July and June! June really looked as if the summer was set and (maybe) we were concerned about the lack of rain. July made up for it all; not quite the wettest in the last 43 years but at 99 mm not far short of the 104 mm recorded in 1991.
Again what we see is a massive variation from one year to the next. 19 of the 43 years showed rainfall above the 51 mm average but with some very dry----and some very wet!
The linear trend is upwards from 42 to 62 mm which looks rather significant to me.
Worldwide July was the hottest on record and sea temperatures have also risen by a degree. Our temperatures on the other hand were nothing to write home about; the maximum was just 26° compared with 37° last year and average maximum and minimum temperatures were well below 2022.
However the pattern of temperatures and rainfall this year have brought things in the garden on early (well mine at least) with tomatoes, French beans and courgettes much sooner than I have come to expect. What of August—well it hasn’t started well but we can live in hope.
August
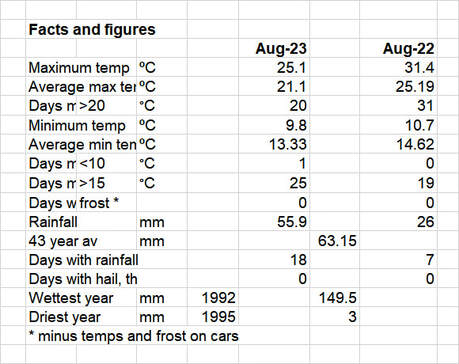
Nothing to write home about is the best summary for this August.
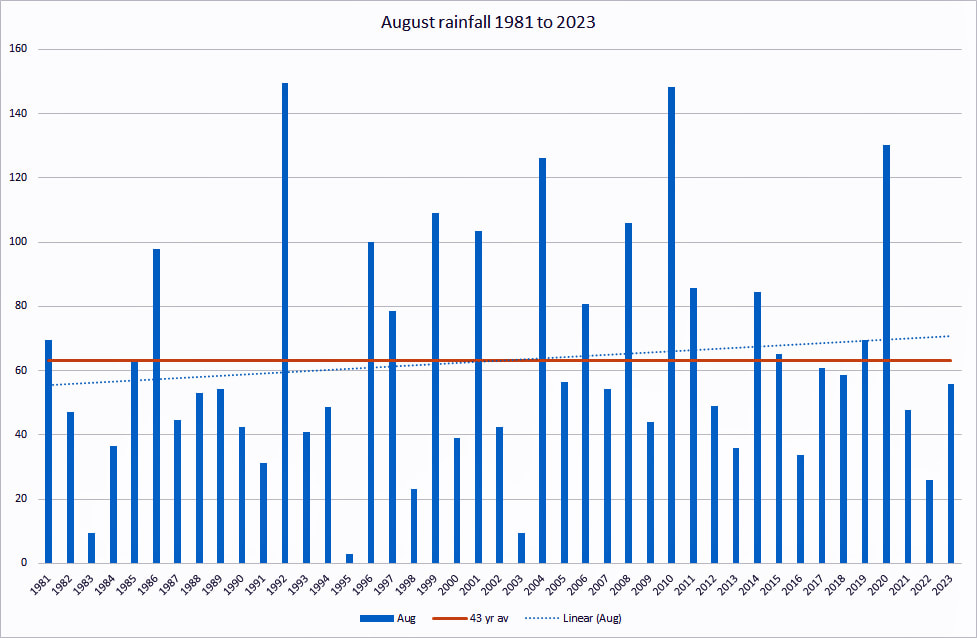
Below average rainfall but there was some rain on 18 days and the temperatures were rather disappointing.
Compared with 2022 it was wetter, cooler and less pleasant all round. Bonus--the grass didn’t go brown.
Over the 43 years August has been getting on average wetter with the trend increasing from about 55 mm to 70mm but this is against a pattern of large variations and no consistency.
The wettest August was back in 1992 with 149.5 mm and the driest in 1995with just 3 mm; 16 years were above the 63 mm average.
What might one conclude; August is very variable and can’t be relied upon!
September
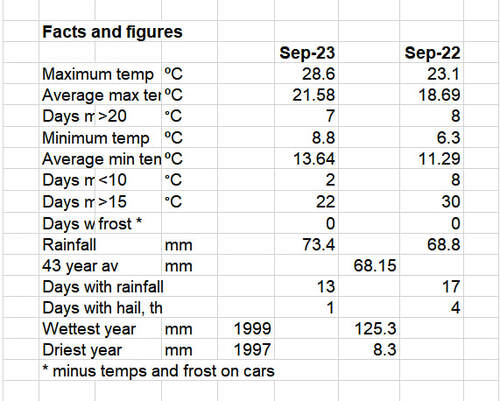
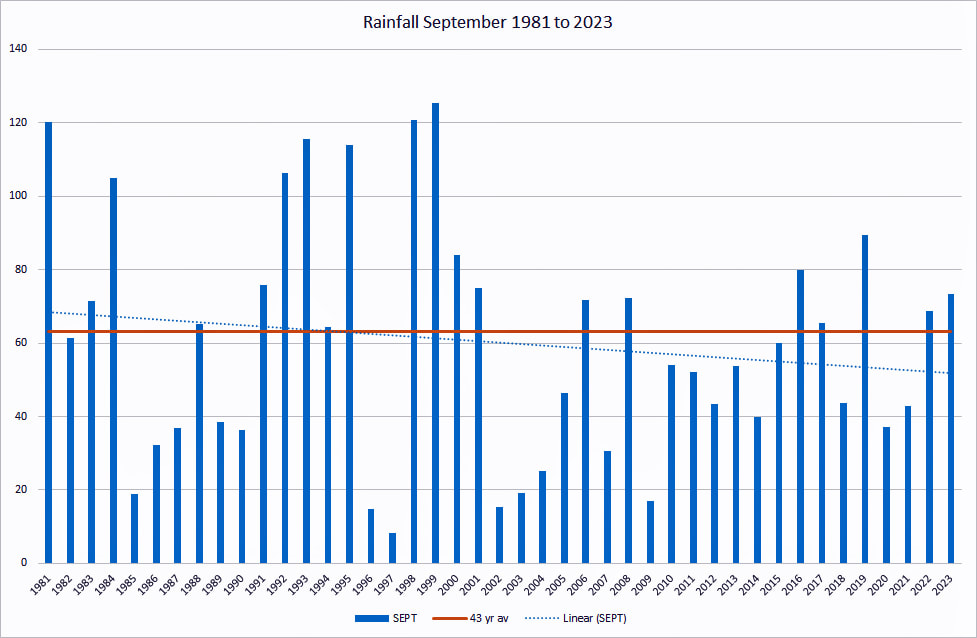
Quite a month; more rain in one day than I can remember (but my memory is not that good!) with 42mm falling on the 20th, a week of maximum temperatures above 25° (although Hyde Heath did not exceed 30° as reported in some parts of the country) and average temperatures higher than August.
We had a rather pleasant amount of sunshine on at least 11 days and although there was a recordable amount of rain on 13 days well over half was on the one day as mentioned earlier.
There were many nights when the minimum temperatures were high; 8 greater than 15° and all but 2 above 10°.
Compared with last year the month was wetter (but in 2022 there were 17 days of rain with a really wet start to the month), warmer both in maximum. minimum and average temperatures, and sunnier.
The trend in rainfall over the 43 years is decreasing but yet again the variance is big with the wettest in 1999 at 125mm and the driest in 1997 at 8mm so this year with 78 mm was about average!
When you look at the west of the UK it is clear that very often the wettest weather does not reach as far as us and we are fortunate to generally miss the extremes in rain and wind.
October
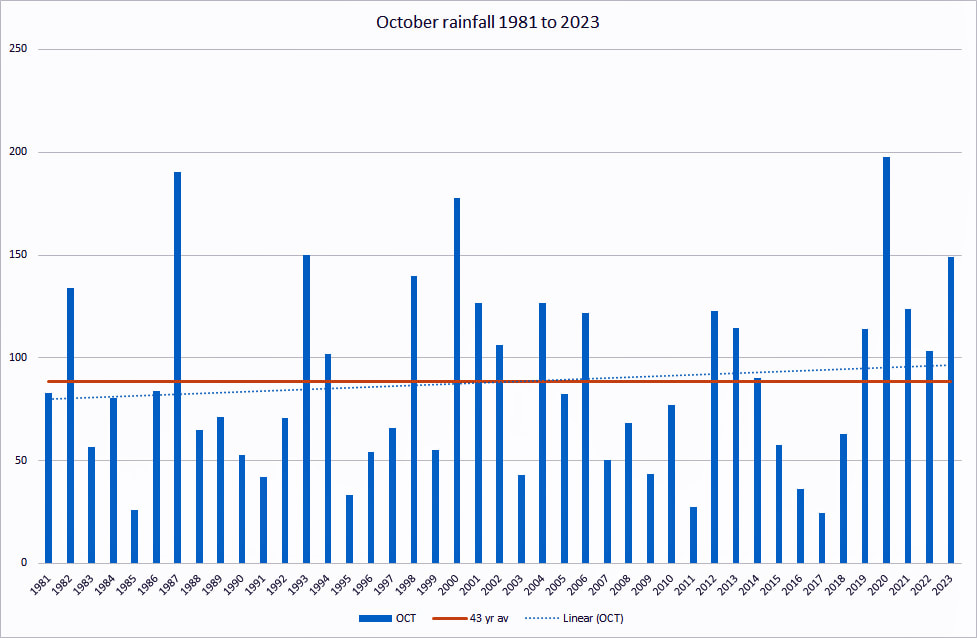
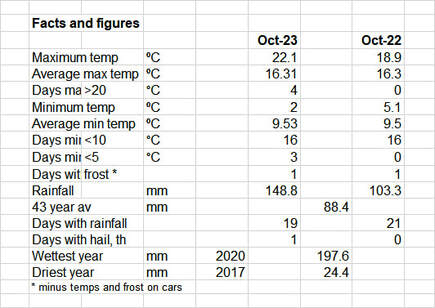
October through to March is “fill dyke” when the water table is replenished; this year has made a good start with almost 150mm of rain over 19 days most of which fell in the second half of the month.
The 19th was noticeable with 32.8 mm in the 24 hours. Compared with other parts of the country who suffered dramatically from storm Babet (where did they get that from!) our rainfall was modest; parts of Scotland had more in a day than Hyde Heath had in the month.
This was not the wettest October in the last 43 years; that fell to 2020 with nearly 200mm.
October is getting wetter with the linear trend up from approx. 82 to 98 mm.
The month started mild with temperatures often in the low 20’s but dropped rather on the 15th with a car frost evident.
Overall though the average maximum and minimum temperatures were very similar to last year. Now we await storm Ciaran.
November
December
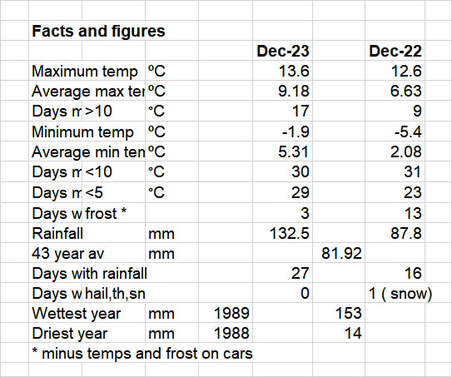
Mild and wet characterised this last December although I suspect that you do not need me to tell you that!
It rained to some extent nearly every day; 27 in fact and even though there were only 3 days with an excessive amount, the remaining days kept topping it up.
As we moved into January there were a few days of really wet weather which led to the flooding as the already saturated ground just couldn’t suck any more wet up
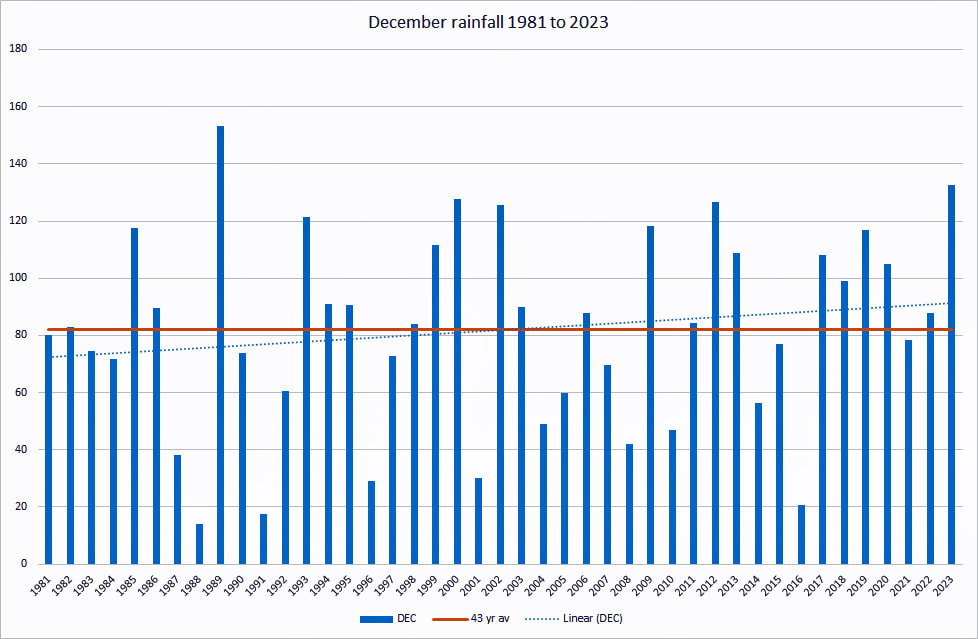
Rainfall was nearly 50% above average at 132mm compared with the 43 year average of 82mm and the trendline is showing Decembers getting wetter. However the variation across the years is dramatic; just 14mm in 1988 with 153mm in 1989. If you look at the chart, the variations are so clear.
Although the maximum temperature this year compared with 2022 is much the same, the average shows a significant rise this year.
The minimum is even more marked with 2022 having 13 days of hard frost compared with just 3 this year and those days were only just below freezing.
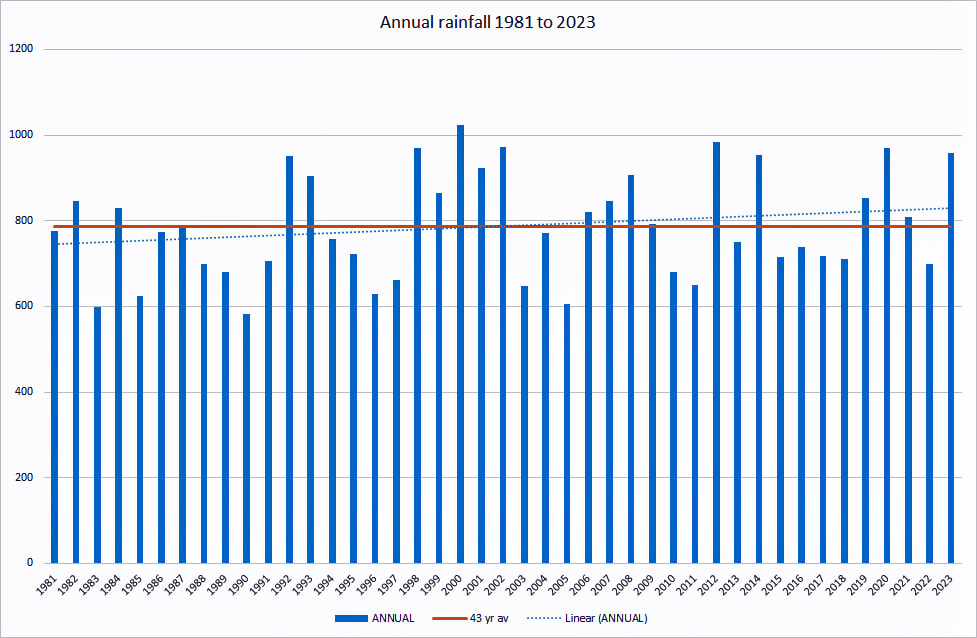
The annual rainfall was above average with a trend again showing an increase.
There were more “named” storms in 2023 than previous years. Significant? Not sure; named storms is a new phenomenon as far as the Met Office is concerned and we will need to have a few years more data to make any judgement (in my opinion).

