
2024 - Hyde Heath Weather Reports by Gary Beynon from his own garden records
January
January
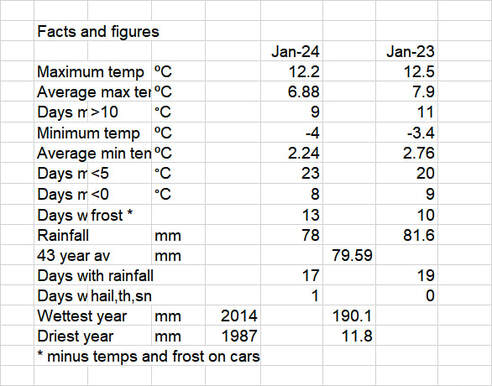
Wet and mild to start then drier and colder followed by an increase in temperature over the last 10 days and more rain.
The maximum temperature was 12.2° with an average for the month of 6.88° but the range was from that high of 12.2 to a minimum of -4°.
The average minimum was 2.24° with noticeable frost on 13 days and 19 days when the temperature did not get above 5°.
Overall rainfall was 78 mm with 4 really wet days (22.4,15.0,10.7 and 14.3 mm). There was a brief snow shower on one day. We also had the “pleasure” of 2 named storms.
Compared with last year the temperatures and rainfall were remarkably similar.
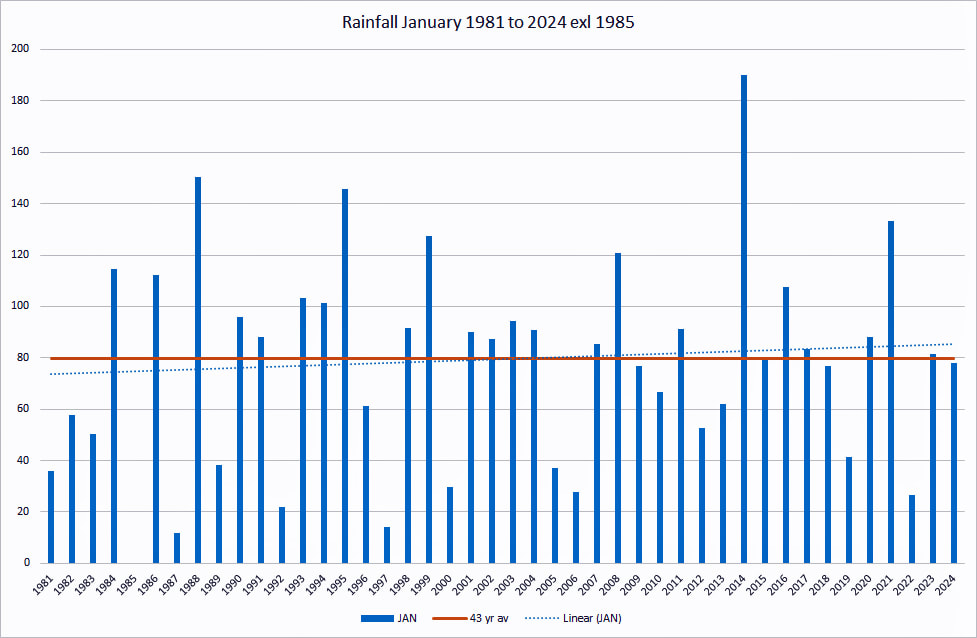
Over the last 43 years the rainfall in January was virtually at the average of 79.6 mm but with a range from 190 to 12 mm. The trend is slightly increasing from 75 to 85 mm; significant ???
February
February
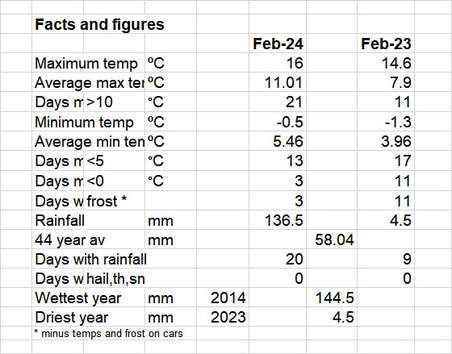
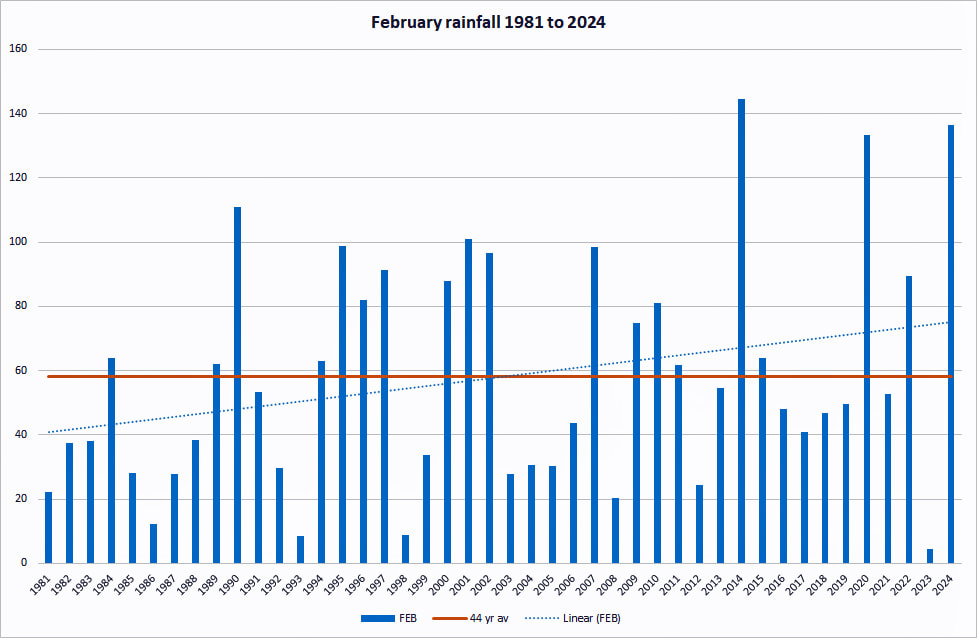
You do not need me to tell you that it was a wet month! Apparently it was the wettest February in over 200 years but actually that was not the case in Hyde Heath when our wettest was in 2014 with 144.5mm compared with ”only” 136.5 mm this year!
In fact we have seen 5 years with greater than 100 mm in the month since 1981.
2014 showed a similar pattern with most days having some rain and a few with a lot; this year there were 20 days with rain and 90 mm falling on 5 of the days.
It is little wonder that the ground could not drain away especially as January was wet also.
The linear trend is increasing from ~40 to 75 mm.
It was also a mild month with a maximum temperature of 16.0° and an average of 11.01° cf last year with 14.6 and 7.9. That difference in average temperatures is significant. There was frost evident on just 3 mornings.
March
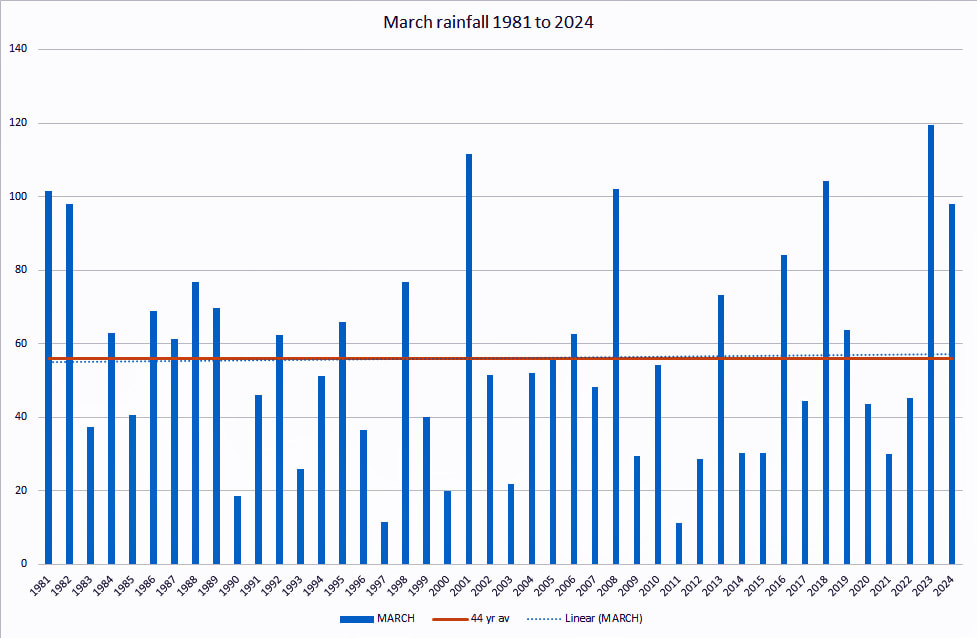
March was a wet month! The gardens are testimony to this as is the amount of water in the Misbourne.
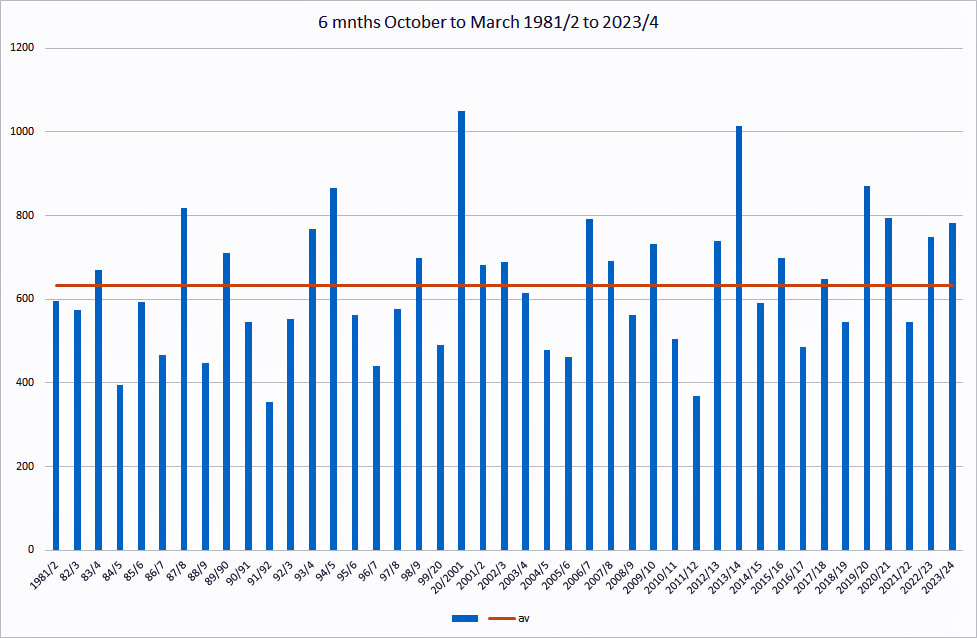
Given that the 6 months rainfall from October last year to March this year was high—but not a record—would suggest that the chances of a hosepipe ban this summer should be minimal; BUT who knows!
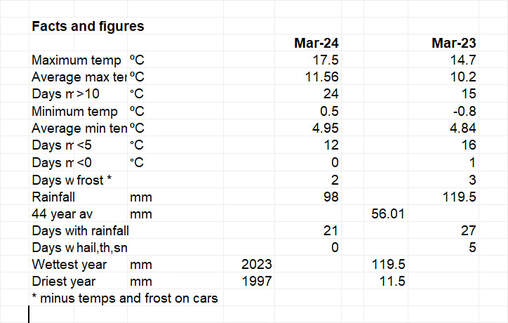
We had 98 mm over 21 days with 3 of those days giving >12 mm (½ inch in old money). However March last year was even wetter with 119 mm over 27 days.
Over the last 44 years the average has been 56 mm so 2 very wet months but to put it into perspective, the trend over those years is virtually flat.
From a temperature point of view March was on average mild with a maximum of 17.5°, somewhat warmer overall than last year. We had just 2 days of frost compared with 2023 which also saw 2 days but 5 days with sleet or snow.
Given that the 6 months rainfall from October last year to March this year was high—but not a record—would suggest that the chances of a hosepipe ban this summer should be minimal; BUT who knows!
We had 98 mm over 21 days with 3 of those days giving >12 mm (½ inch in old money). However March last year was even wetter with 119 mm over 27 days.
Over the last 44 years the average has been 56 mm so 2 very wet months but to put it into perspective, the trend over those years is virtually flat.
From a temperature point of view March was on average mild with a maximum of 17.5°, somewhat warmer overall than last year. We had just 2 days of frost compared with 2023 which also saw 2 days but 5 days with sleet or snow.

April

I thought that April was going to be a much colder month than many we have had; other people said how wet it had been. The facts don’t support either view.
It probably shows just how much we are influenced by the very recent past rather than the whole picture.
April started mild (even warm) for the first 2 weeks with the temperature reaching 19.7° on one day. The next 2 weeks were a lot cooler and we only saw a recovery on the last 2 days of the month.
Compared with April last year,temperatures were not dissimilar. We used to associate April with showers but this year saw more prolonged periods of rain albeit generally not that heavy; Saturday 27th was quite the exception when 24mm fell (nearly an inch in old parlance).
There was 1 day with thunder and hail but we were free of frost. Looking at the last 44 years, rainfall was a little above average but the amounts have varied dramatically from a 139mm in 2000 down to just 2.6mm in 2007. Overall the trend over the years has been getting less rainfall.

