Hyde Heath Weather Reports 2018 .... by Gary Beynon from his own observations
|
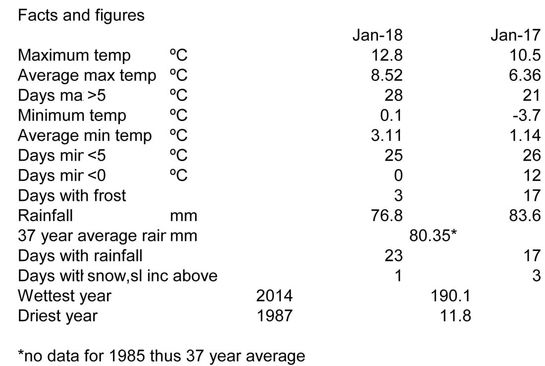
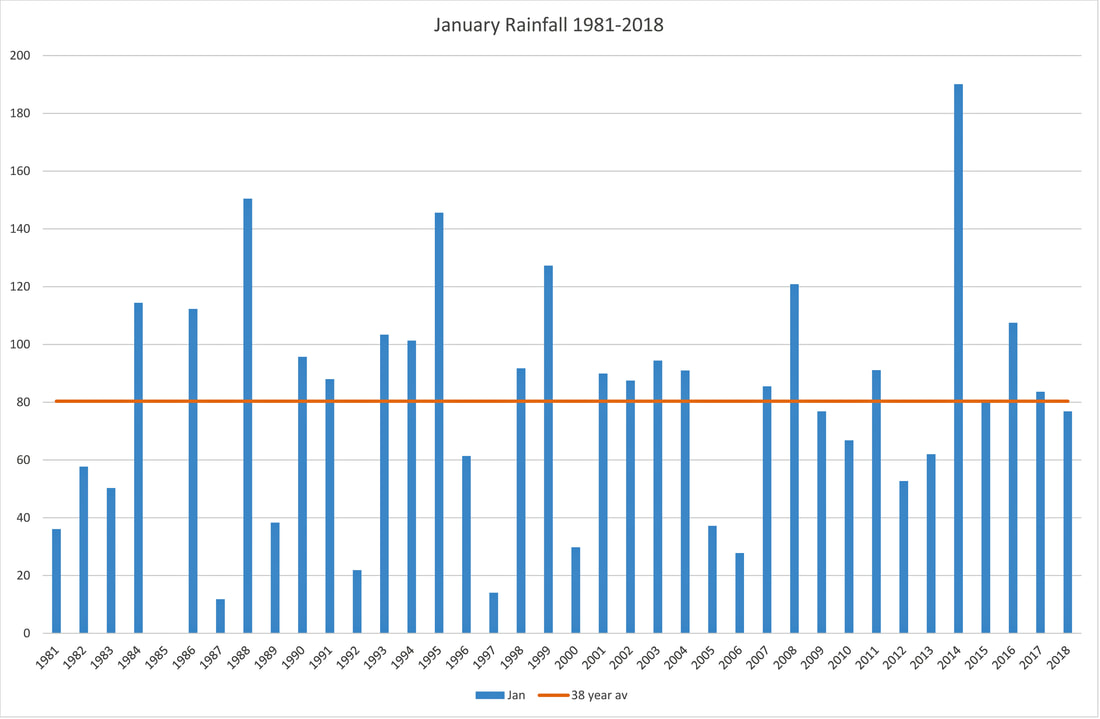
As reported by the Met. Office this past January was particularly mild compared with the norm. Even compared with January 2017 the month was a deal warmer. The max temperature was 12.8 cf 10.5°C and the average max some 2° higher. More noticeable were the number of days of frost with 12 in 2017 yet just 3 this year. Rainfall was close to the average at 76.8mm; a long way below the wettest January at 190.1mm and way above the driest at 11.8mm. The water table must still be low as the Misbourne is flowing but not with any conviction, and the same is true, I am told, of the Chess and Gade. It was generally a dull month with cloud and rain on 23 days---but at least the afternoons are getting longer, the snowdrops are super, and the daffodil and bluebell spikes are showing well.
|
January 2018
x
|
|
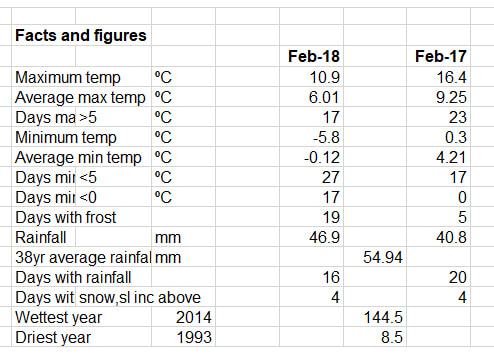
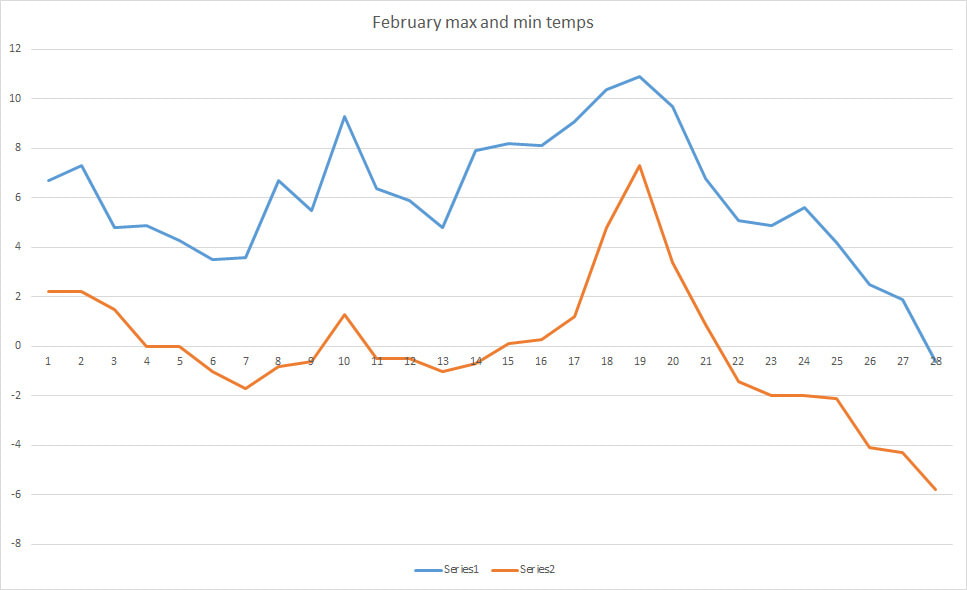
February had a sting in the tail with temperatures falling away somewhat dramatically (see chart of max and min temps). The temperatures were significantly below last year and the first few days of March have maintained the cold spell. The middle of the month was “warm” with a max of 10.9°C but it was down hill from there onwards. Rainfall was below average but similar to last year; the winter months are still drier than we need with rivers running low or not at all. The snow at the month end certainly disrupted things and the wind (the so called “Beast from the east”) whipped up some rather spectacular snow drifts. However we have been let off lightly compared with people in other parts of the UK. |
February 2018
|
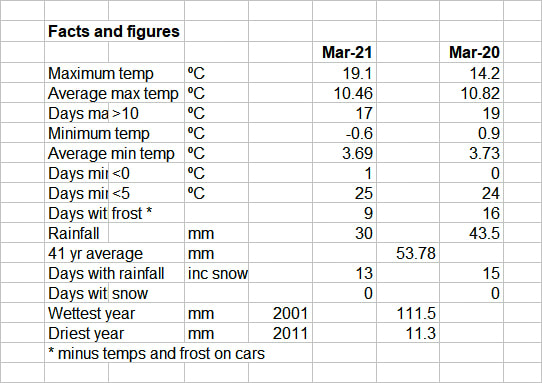
March 2018
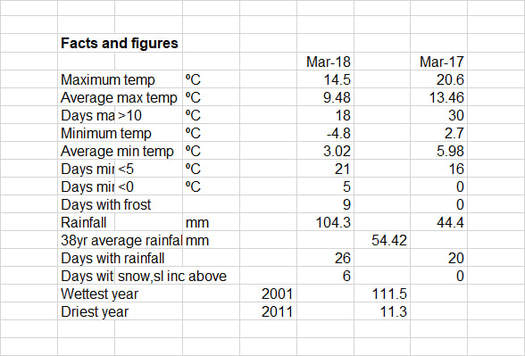
I think that most people will have been pleased to see the end of March. The weather really was pretty awful with snow, rain and cold strong winds. The variation in temperature from one day to the next was remarkable with, for example, a maximum of 14.5°C on 16th and dropping to 0.6°C on the 17th day. The temperatures went up and down like a yo-yo with comparatively mild periods and then artic blasts. The snow caused some disruption and a number of rather spectacular drifts especially part way down Pipers and through South Heath towards The Lee. The month was not especially wet---until the last 6 days that accounted for 41mm. Compared with March 2017, this year was colder, wetter and we had snow.
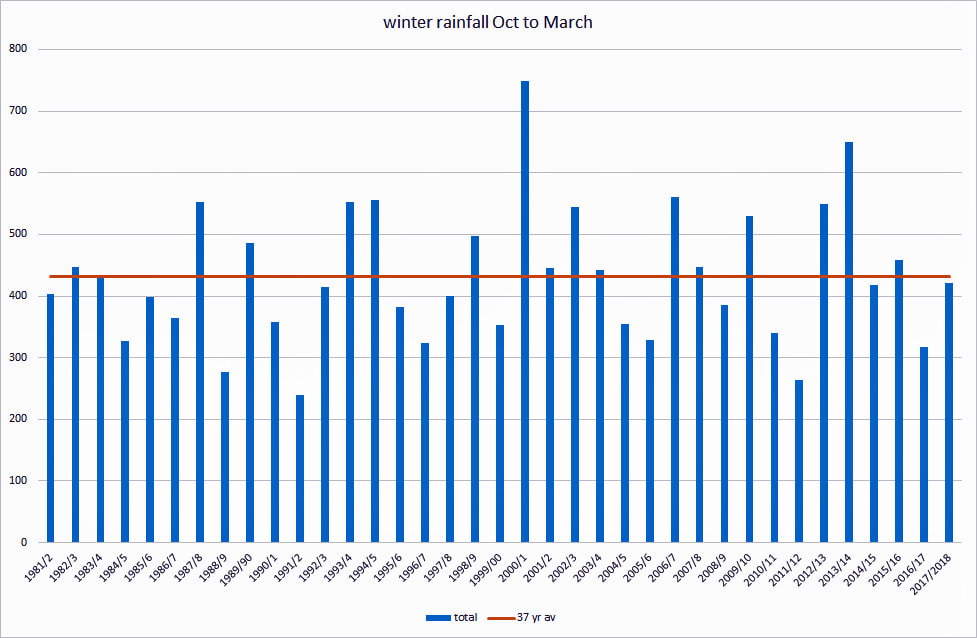
The Winter rainfall—October through to March—that fills the water table was very close to the 37 year average but whether it has been enough to stop water restrictions remains to be seen.
I think that most people will have been pleased to see the end of March. The weather really was pretty awful with snow, rain and cold strong winds. The variation in temperature from one day to the next was remarkable with, for example, a maximum of 14.5°C on 16th and dropping to 0.6°C on the 17th day. The temperatures went up and down like a yo-yo with comparatively mild periods and then artic blasts. The snow caused some disruption and a number of rather spectacular drifts especially part way down Pipers and through South Heath towards The Lee. The month was not especially wet---until the last 6 days that accounted for 41mm. Compared with March 2017, this year was colder, wetter and we had snow.
The Winter rainfall—October through to March—that fills the water table was very close to the 37 year average but whether it has been enough to stop water restrictions remains to be seen.
April 2018
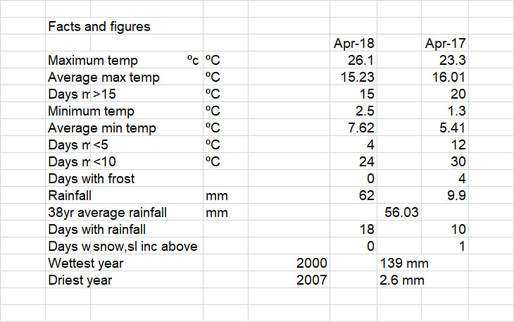
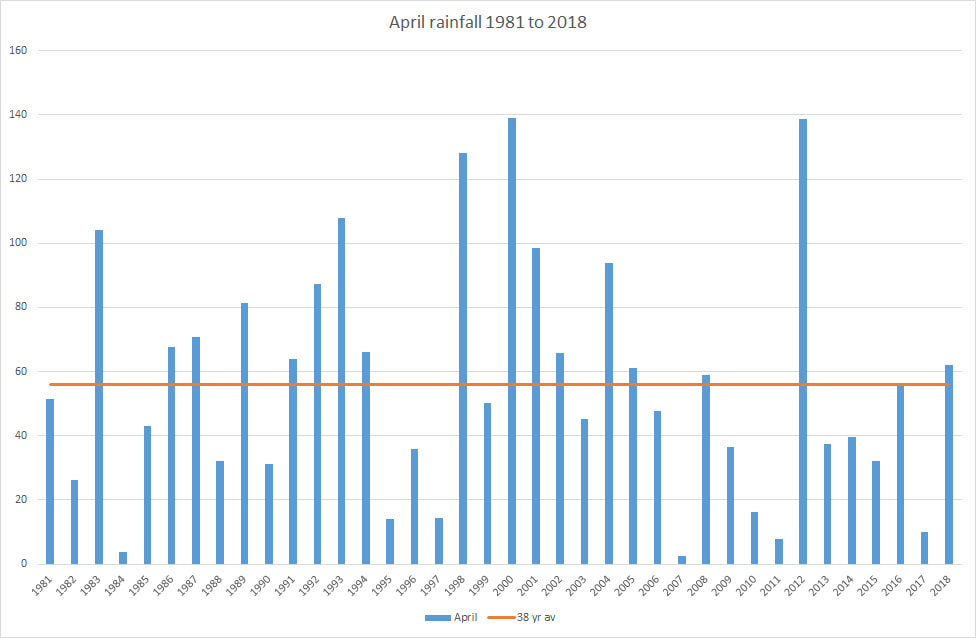
April was a month with some very different weather. We hit a high of 26.1°C on 19th and the last day saw a minimum of just 2.5°C. We had just about everything else in between. There wasn’t a great deal of rain but there was little opportunity for the ground to dry out with 18 days of some precipitation and many days with cloud. The Misbourne down by Shardeloes did look fuller than it has done but not for long. Compared with 2017, April was marginally cooler during the day and significantly warmer overnight.
Last April we did have some frosts, and 1 day with snow; at least we were spared that this year. The Easter Bank holiday was nothing special but as I write this the early May holiday looks very promising.
May 2018
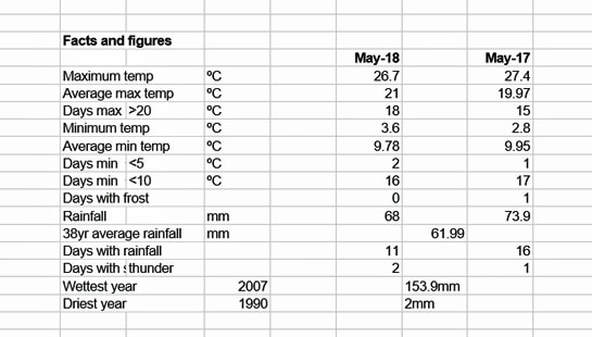
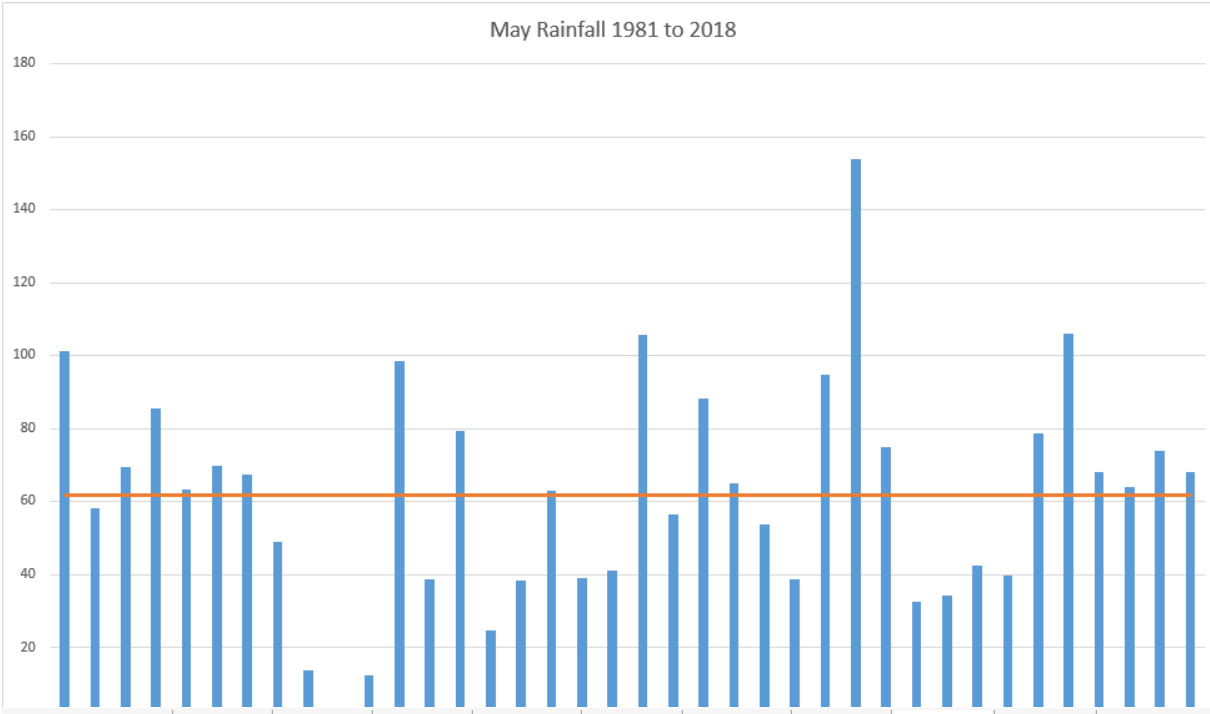
A real mixture of weather ranging from hot sun and cloudless skies to totally cloudy and a cool northerly wind. Throw in some distant thunder storms and very heavy rain and all that was missing was snow. There were two periods of hot sunny weather; one in the second week and the other at the end of the month. The Fête weather was not kind with rain and cloud; fortunately the fly past by a spitfire went ahead but unfortunately the youngsters from school got wet doing their display. Two thirds of the rainfall was on just three days over a four day period. Compared with May 2017, the data shows it to have been very similar and the rainfall (both years) was just above the 38 year average.
A real mixture of weather ranging from hot sun and cloudless skies to totally cloudy and a cool northerly wind. Throw in some distant thunder storms and very heavy rain and all that was missing was snow. There were two periods of hot sunny weather; one in the second week and the other at the end of the month. The Fête weather was not kind with rain and cloud; fortunately the fly past by a spitfire went ahead but unfortunately the youngsters from school got wet doing their display. Two thirds of the rainfall was on just three days over a four day period. Compared with May 2017, the data shows it to have been very similar and the rainfall (both years) was just above the 38 year average.
June 2018
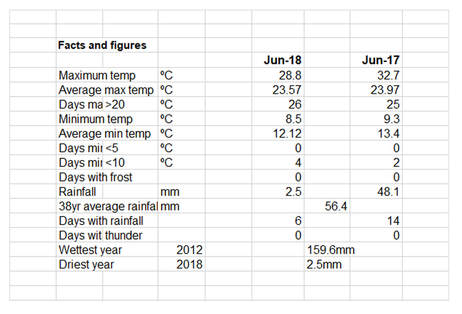
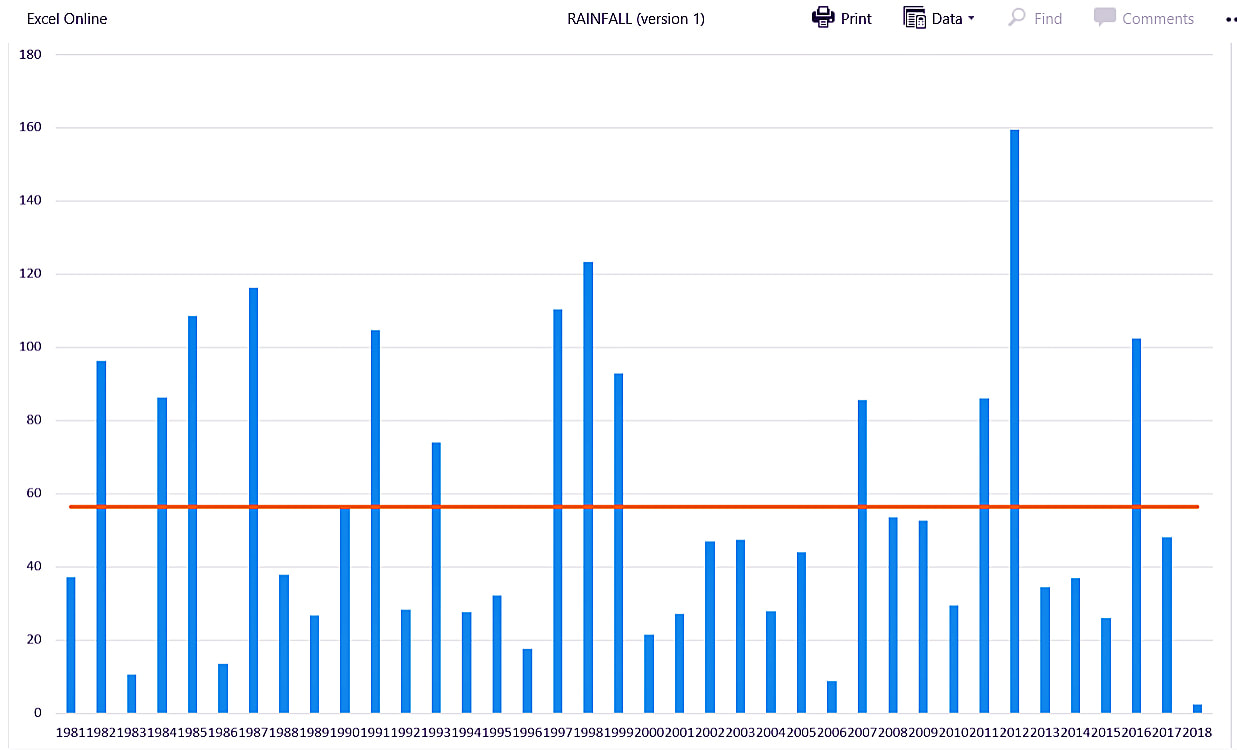
Warm, sunny and very dry is a good summary of this June. The brown state of the grass is a very visible indicator of just how dry it has been. The lack of rainfall, the high number of sunny days (17 were mostly sunny) and the often strong northerly breeze have combined to dry most plants and grass out. This June was not dissimilar from last year which although wetter was actually warmer with a high of 32.7°C compared with a mere 28.8° this year! This has been the driest June since I have kept records with just 2.5mm falling; this compares with a 38 year average of 56.4mm and a high of 159.6mm in 2012. These contrasts are quite marked. As I write this the hot weather is continuing with little or no sign of rain in the forecast.
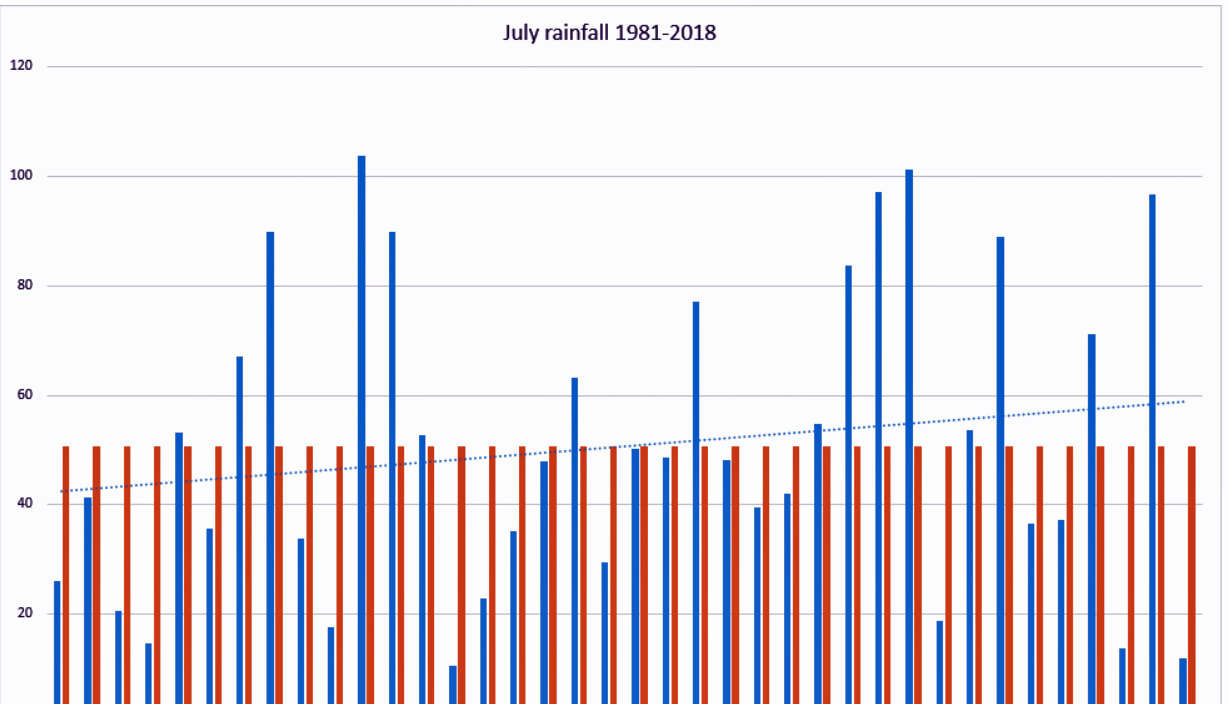
July 2018
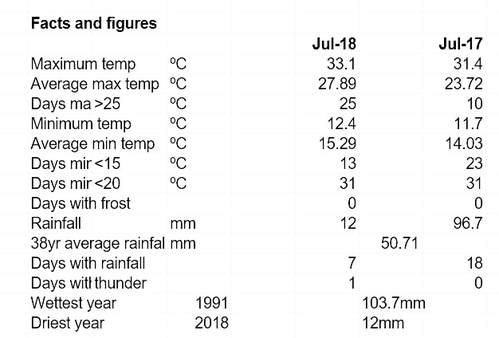
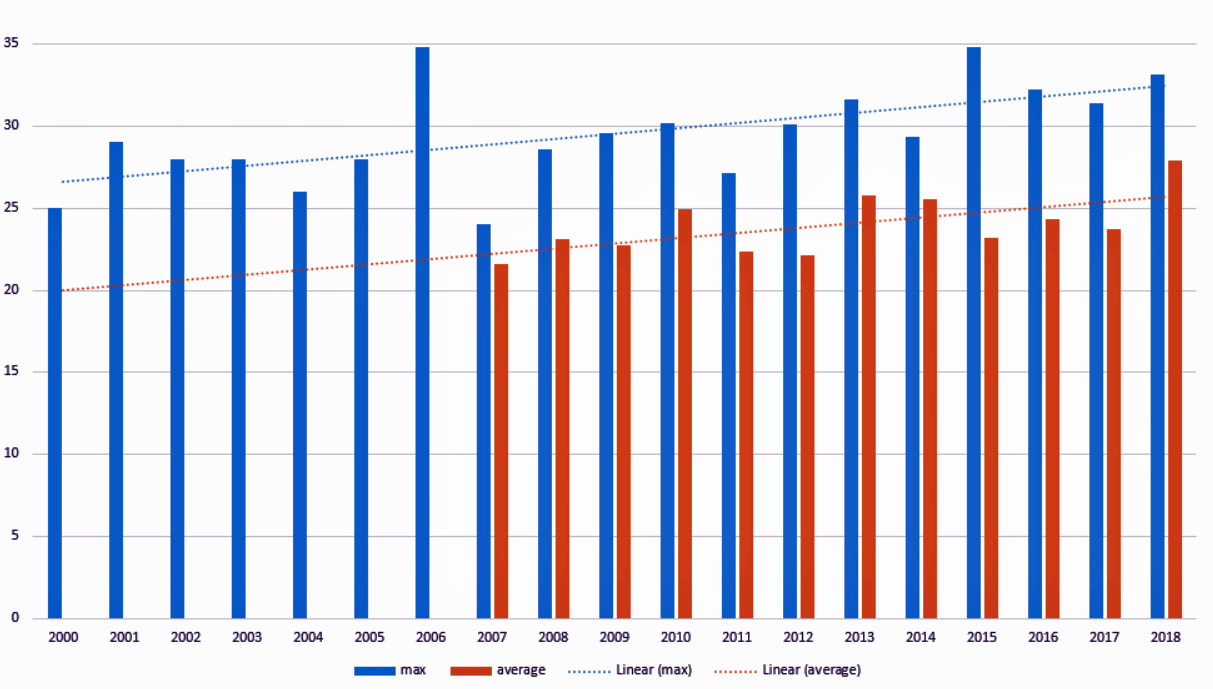
I hardly need to remind you that it was hot and dry throughout July. Temperatures remained high even after the schools had broken up; usually the marker for colder and wetter weather! The grass in the fields is testament to the prolonged dry spell that we are still experiencing even as the month changes and dire warnings are now being made about shortages of fodder for animals and higher prices in the shops due to lower crop yields. So far we have not had a hosepipe ban but rainfall levels are really very low; July saw 5 times that of June but 5 times very little is still not much. The combined rainfall in June and July amounted to a mere 14.5 mm compared with a 38 year average for the same period of 102.1mm. Added to this, we had quite a deal of breeze/ high wind after the rain that did fall so even less would have penetrated the rock hard ground. Although it was hot, last July did see similar highs but not for as long. The average maximum temperature was 27.89°C compared with 23.72°C in 2017; over 4° is significant. I have included a graph of maximum temperatures in July for the past few years together with the averages for the month; although it is unwise to base anything on relatively little data the linear trend lines do seem to be creeping upwards—watch out for next year and a big drop perhaps. The president of the NFU remarked on the news this morning that nature has a habit of evening things out over a period of time. Let’s enjoy the summer while we can as I am sure it will rain soon enough
July Max & Min Temperatures 2000 - 2018
August
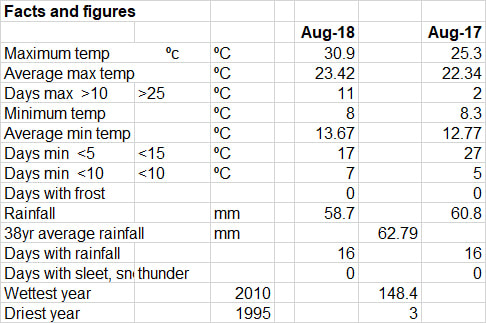
- August started very much as July had finished with hot and dry days. It was not until 9th that we saw a dramatic change with some rain and a 10° fall in temperature from approx. 30 to 18°.There were then 8 days when a total of 37.4mm of rain fell; the grass became greener! Temperatures recovered somewhat but really we were at the level to be expected in August. The rainfall was just below the 38 year average at 58.7mm; the wettest year being 2010 at 148.4mm and the driest 1995 at a mere 3mm. It is easy to remember only the extremes of weather by a month end but it is interesting that I noted just 8 days as being predominately sunny, the rest were either partly or totally overcast.
September
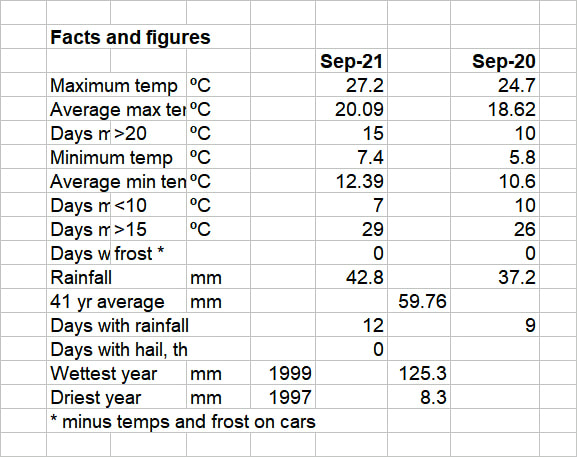
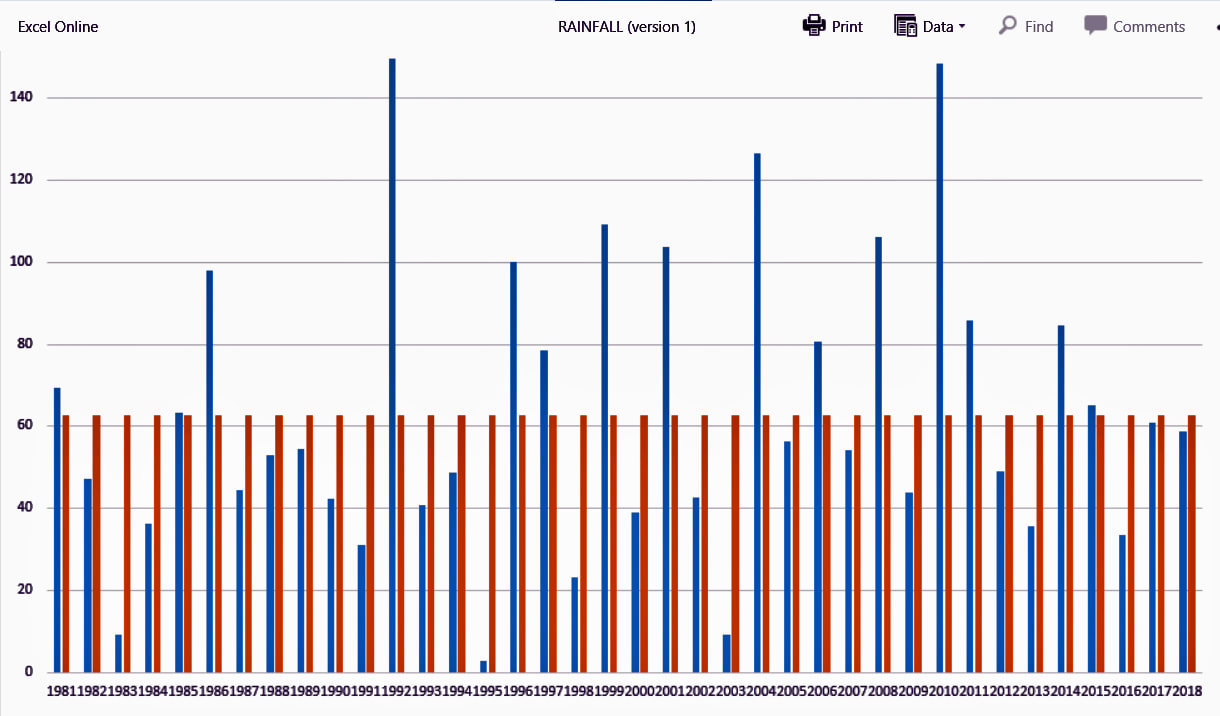
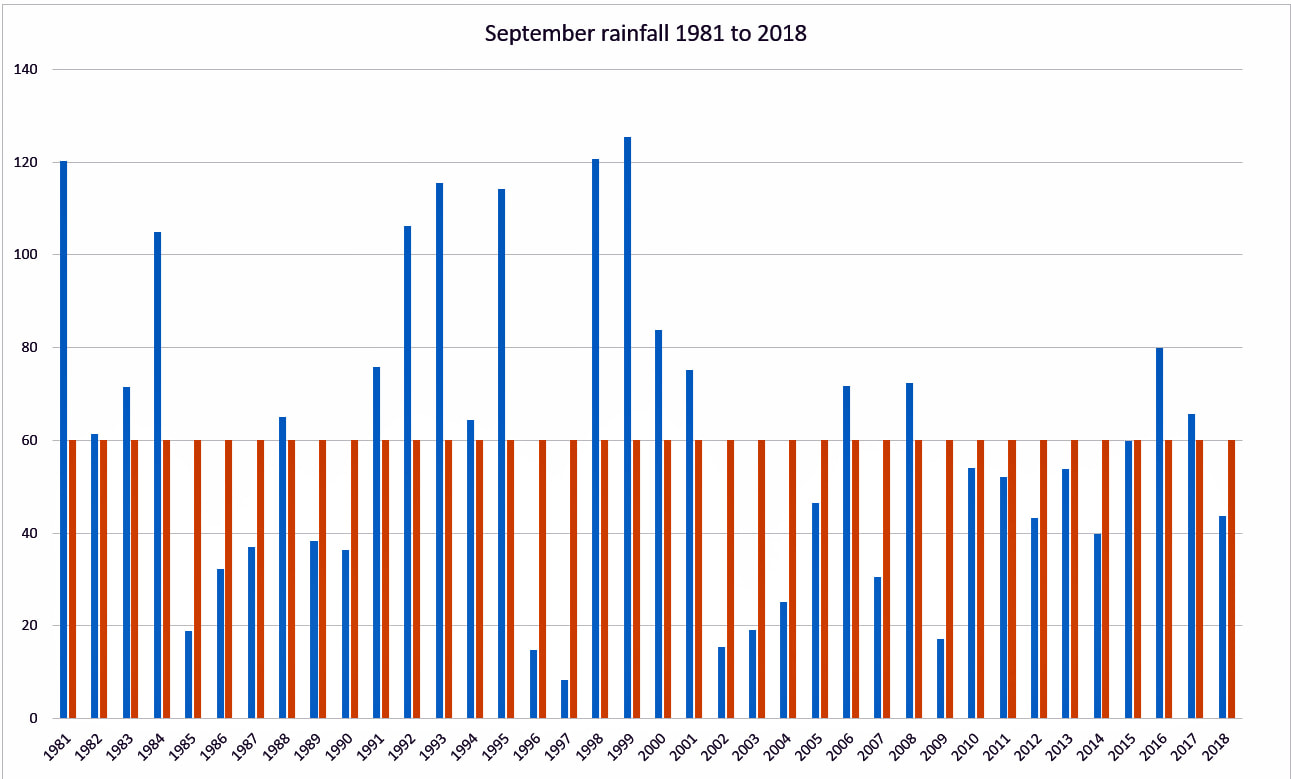
Another comparatively dry month; May was the last month where the rainfall was greater than the 38 year average. This September was about 60% of the average, well below the wettest in 1999 with 125.3 mm but way above the dry 1997 at 8.3 mm. Most of the rain that did fall was in a 6 day period in the middle of the month and this was a marker for the minimum temperatures to fall significantly into single figures. There was a lot of sunshine through the period which also saw 2 storms going through which, by and large, missed us although we did see the wind increasing. Overall a pleasant month and although coming into Autumn not with any conviction.
Another comparatively dry month; May was the last month where the rainfall was greater than the 38 year average. This September was about 60% of the average, well below the wettest in 1999 with 125.3 mm but way above the dry 1997 at 8.3 mm. Most of the rain that did fall was in a 6 day period in the middle of the month and this was a marker for the minimum temperatures to fall significantly into single figures. There was a lot of sunshine through the period which also saw 2 storms going through which, by and large, missed us although we did see the wind increasing. Overall a pleasant month and although coming into Autumn not with any conviction.
October
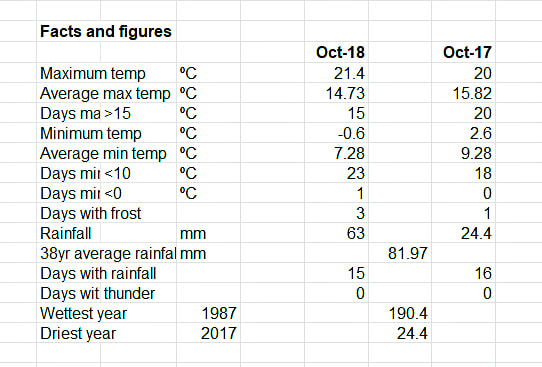
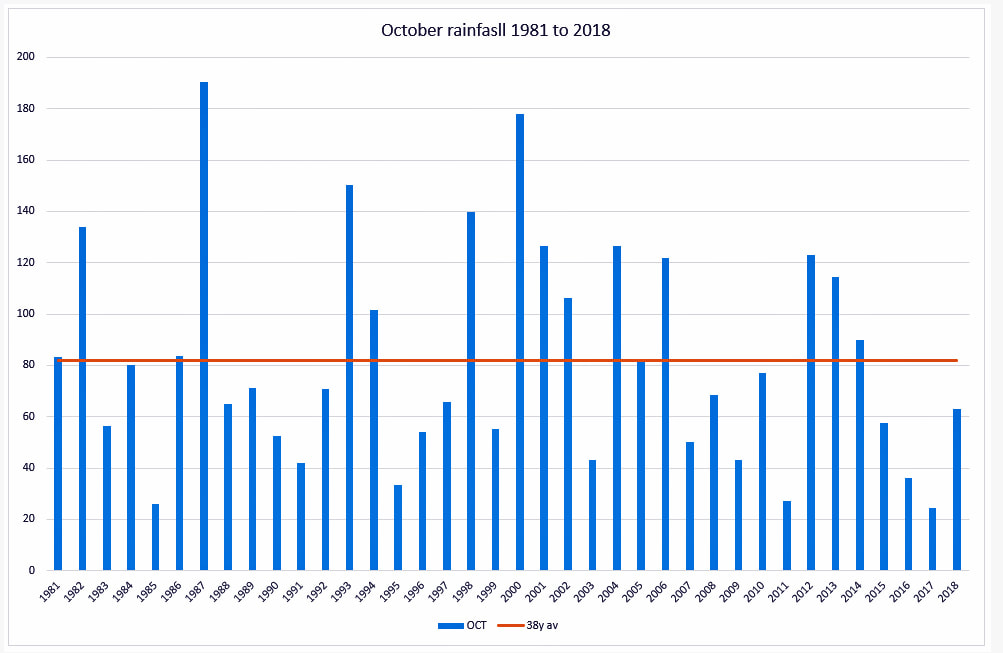
October was a mild month with some pleasant sunshine and a few days of very heavy rain. Compared with 2017, the months were very similar although this October was much wetter but as 2017 was the driest October in 38 years that is hardly surprising. The wettest day was on 14th with 27.3 mm; this was a small amount compared with the 218 mm recorded at Libanus (Great Missenden School summer trip) in the Brecon Beacons. The mild temperatures caused the grass to keep growing (and need cutting!) and I was able to pick Runner Beans in the 3rd week. The minimum temperatures fell noticeably in the last few days with frost on the car windscreens but only the 30th actually recorded a minus figure on my thermometer. So far this year we have had 538 mm of rainfall which is going to require a wet November and December if we are even to reach the 38 year average of 780 mm.
November
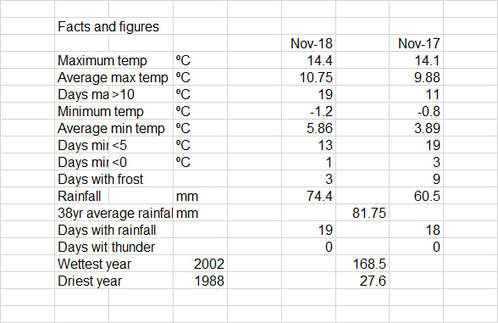
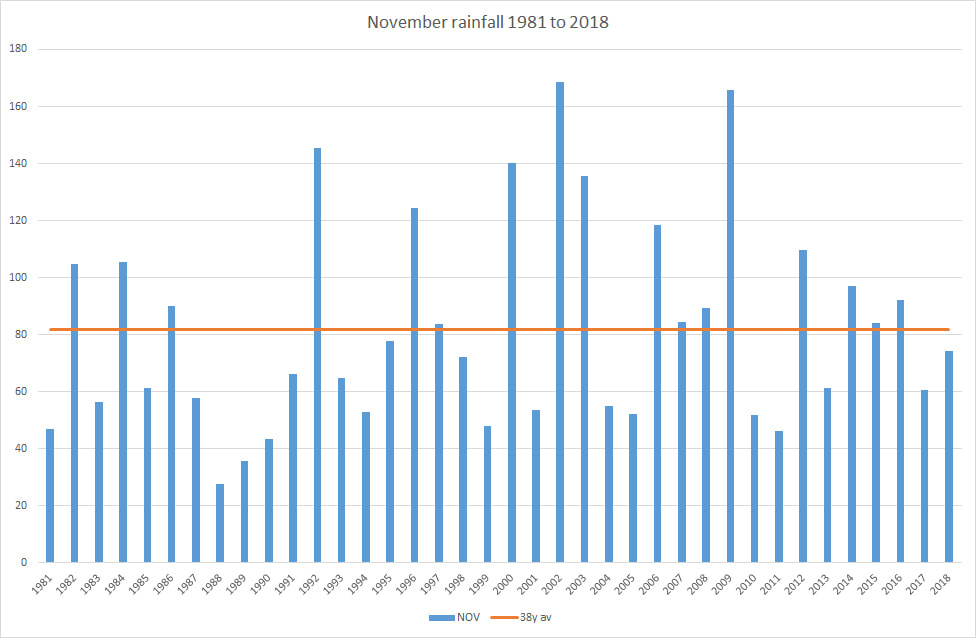
A fairly mild month with just 3 car scraping mornings and temperatures not dissimilar from last year. The leaves kept hanging onto the trees and there was only the 1 morning when the temperature dropped below zero. There was some level of rainfall on 19 days but the bulk fell early in the month (34mm) and the rest at the very end (26mm). It was another month with below average rainfall and actually the second wettest month of the year just being pipped by January. Just as a snapshot, November 2010 had 12 days with frost, less rain, a minimum temperature of -5 and a maximum of 17.3. Trying to use previous data to predict what will happen would not work!
December
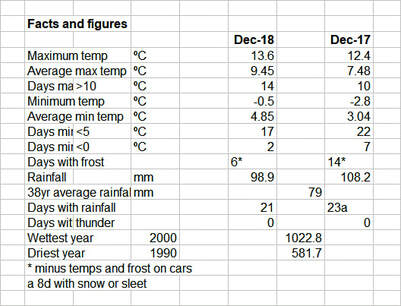
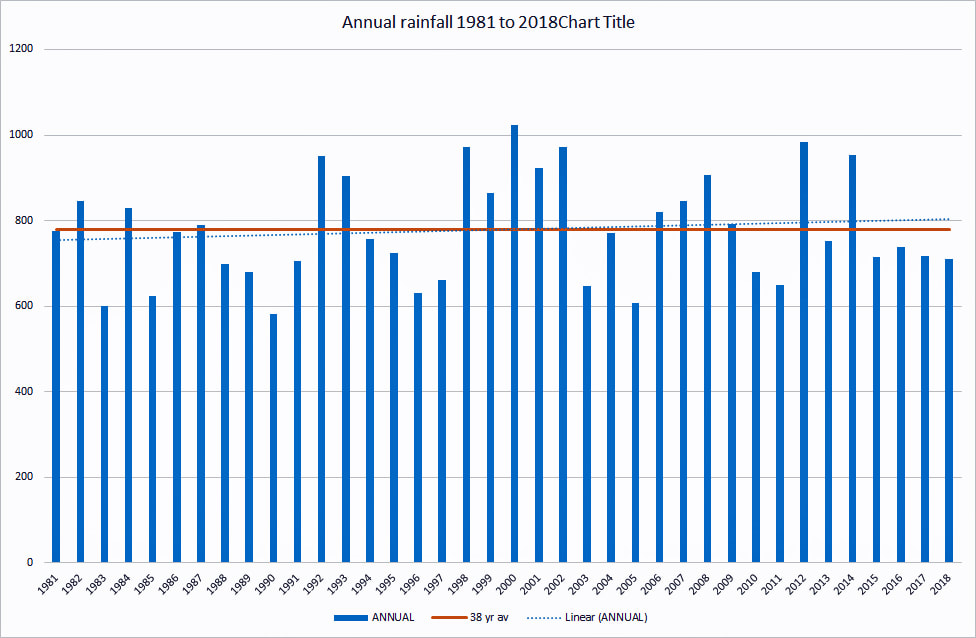
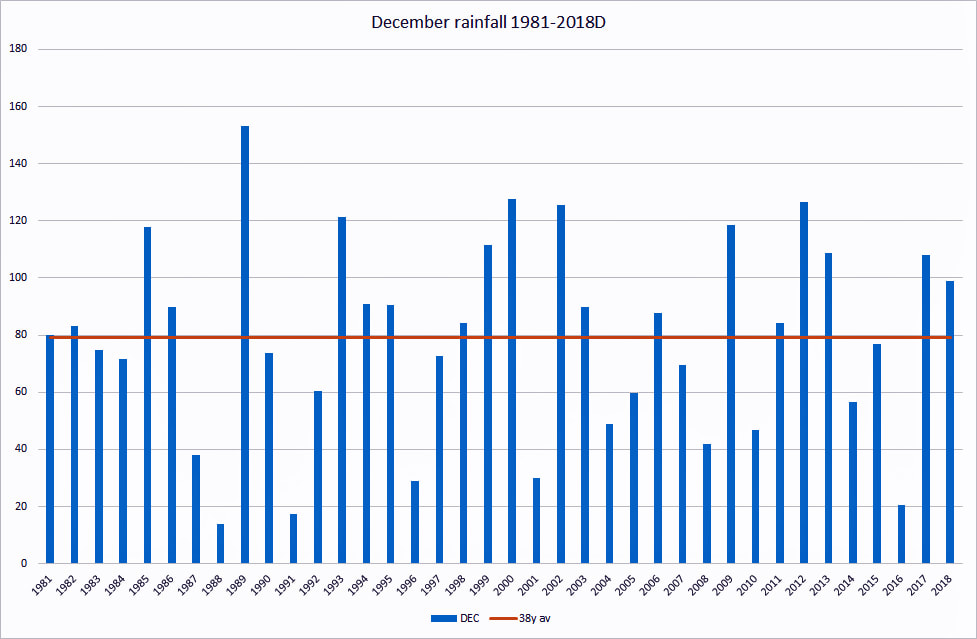
December was the wettest month of the year surpassing last January by some 25% with 98.9mm. It was also wetter than the 38 year average for December at 79mm.
The year started to make up belatedly for a succession of drier than average months; the year finishing with 711mm being below the 38 year average of 778mm. But what a contrast with December 2017; that was wetter, we had snow or sleet on 8 days and 15 days with frost. 2018 was warmer, no snow and just 6 days when frost was evident.
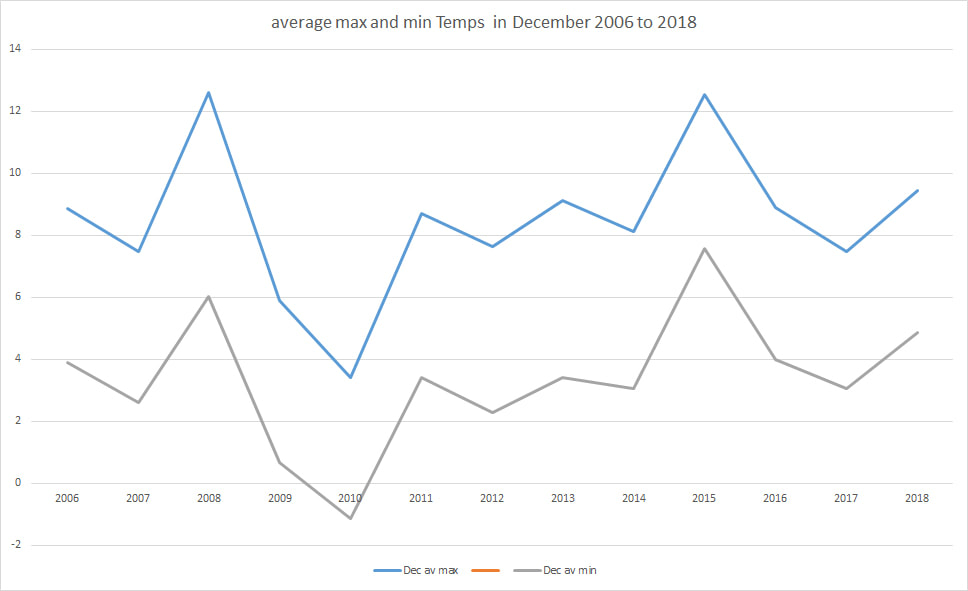
I had a look at the average max and min temperatures over the past few years in December; no pattern at all !
The year started to make up belatedly for a succession of drier than average months; the year finishing with 711mm being below the 38 year average of 778mm. But what a contrast with December 2017; that was wetter, we had snow or sleet on 8 days and 15 days with frost. 2018 was warmer, no snow and just 6 days when frost was evident.
I had a look at the average max and min temperatures over the past few years in December; no pattern at all !