Hyde Heath Weather reports by Gary Beynon from his own garden observations and measurements
January February March April May June July August September October November December
January February March April May June July August September October November December
January
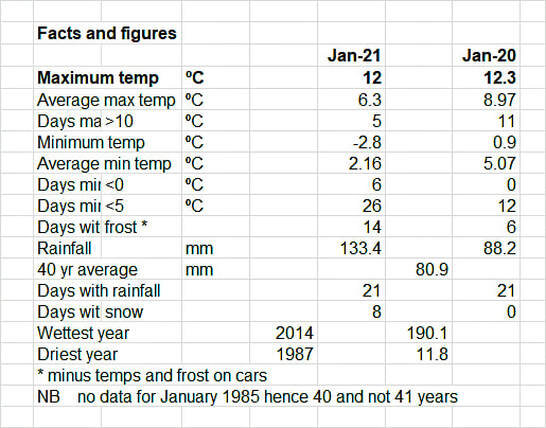
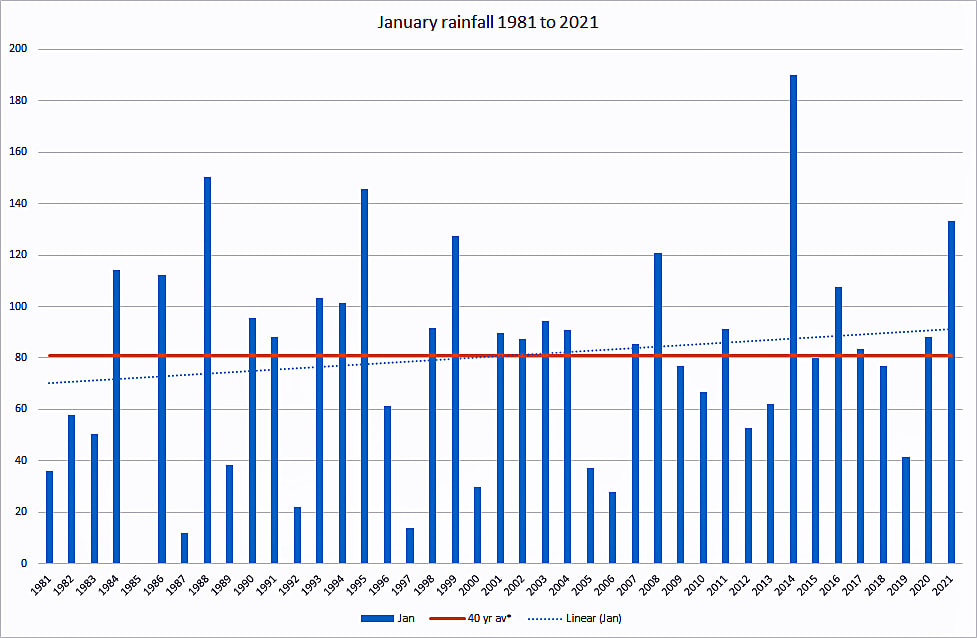
You only have to look at the fields and some of the roads that were flooded to realise that January was a wet month.
There were two very wet days with 23 and 19.8mm but it was the ongoing rainy (and snowy) days that just added to the overall picture. Rainfall was over 50% above the 40 year average; not the wettest January which was in 2014 at 190.1mm and with over half of the 40 years with above average rainfall.
The trend over the 40 years is getting wetter and January rightly has a reputation for being wet!
There was snow as well which caused the usual chaos despite the small depth. We had 8 days when some snow or sleet fell; something we are not especially used to in Hyde Heath. The temperatures were all over the place ranging from a maximum of 12.0° to a minimum of -2.8°.
However, compared with January 2020, this January was actually colder but from the figures the various averages are distorted by the differences in temperatures sometimes on a day to day basis.
Part way through the month my Oregon Weather Station started to play up a bit (many years old) so I bought another; since then it has of course worked fine but I saw this as a warning.
I have compared the readings for 2 weeks and find that the new instrument reads between 0.5 and 0.8° lower than the old one with both the max and min figures; using frosts as a guide the new instrument looks to be more accurate.
As of February I will be only using my new instrument---providing it doesn’t fail on me!!
February
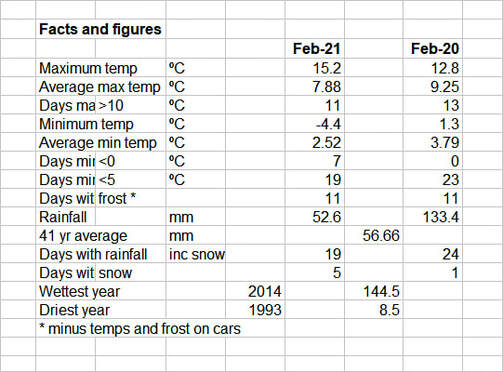
February turned out to be a month of contrasts; on the one hand the temperature shot up to a dizzy 15.2°C, and on the other saw a minimum of -4.4°C. There was a cold spell early in the month with temperatures hovering around freezing all day (on just one day,10th, it didn’t actually get above 0°)
Then a warmer second half with temperatures at maximum between 10 and 15°. Little wonder that the daffodils and crocus all came out.
There was frost evident on 11 days and snow flurries on 5 days which fortunately didn’t amount to much. The ground has now dried out a good deal compared with the start of February which saw most of the rainfall.
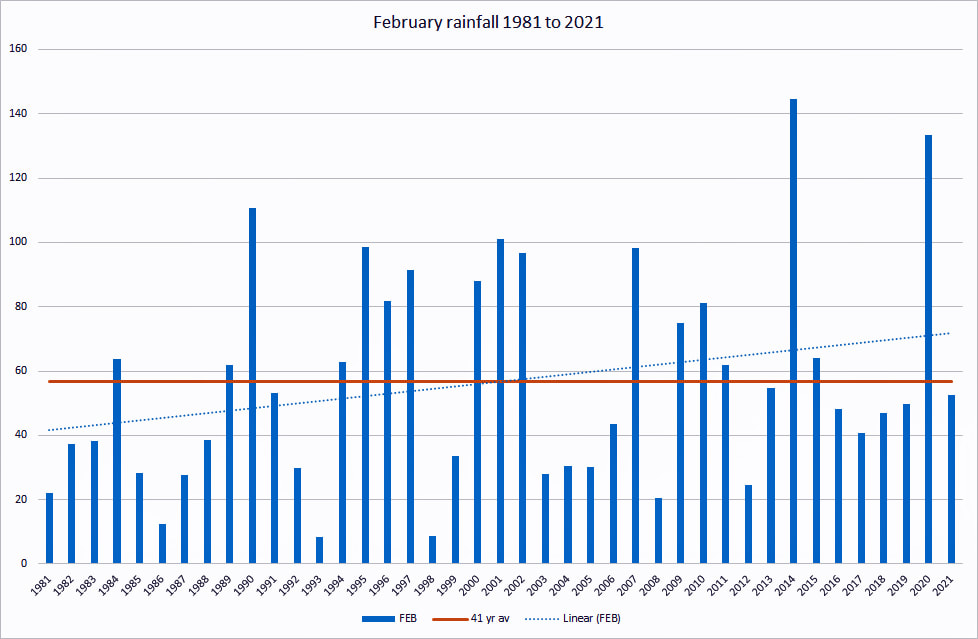
Rainfall was below the 41 year average at 52.6mm but the average figure hides a very wide range from 8.5 up to 144.5mm.
Interestingly the rainfall trend over the last 41 years shows that it is getting wetter with the trend line going from about 40 to 70+mm.
Compared with February 2020 this year was drier, less warm (despite the dizzy maximum) and colder. Last year saw about the same number of frosts but no hint of snow although there was a fall in Stokenchurch on the 10th, and you may remember Storm Dennis (it gave us a ruff time).
March
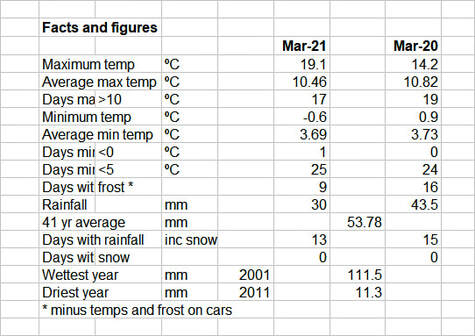
March was a dry month with some very pleasant warm days in the last week.
The nights were cold as one might expect this early in the year with frost evident on 9 mornings and 25 days when the minimum temperature was less than 5°.
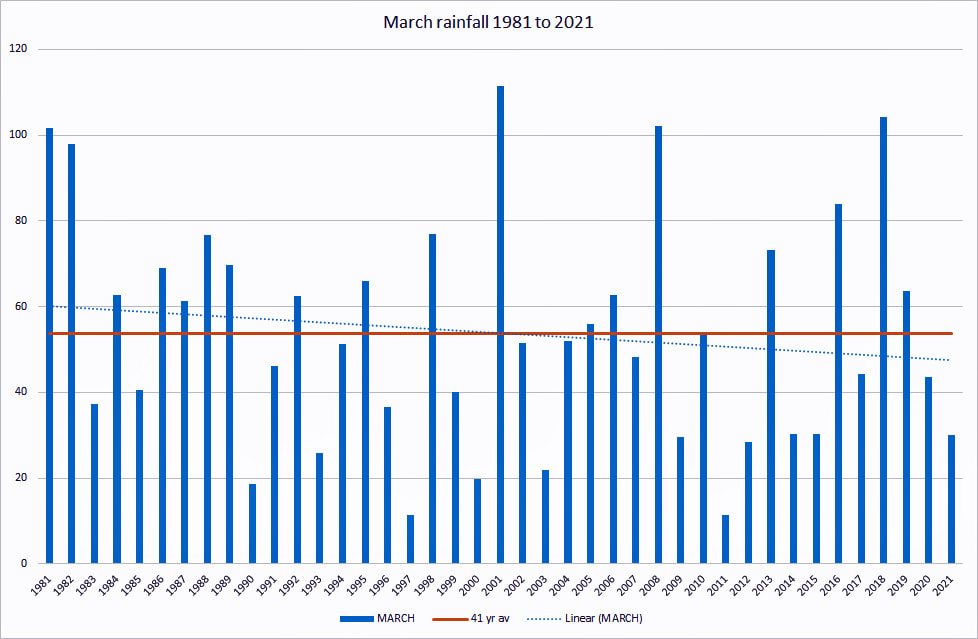
The maximum day temperature was 19.1°but the average maximum over the month was a more normal 10.46°. This average compared closely with last year. Apart from the higher maximum the two months were very similar. Rainfall in both years was below the 41 year average but not by a great deal.
The highest rainfall was in 2001 at 111.5mm and the driest in 2011 at just 11.3mm. A month really with wide variations with 18 years above the average but with an overall trend showing it getting drier.
The ground, as I am sure you are aware, is pretty hard but the Misbourne is good and full and flowing well.
April
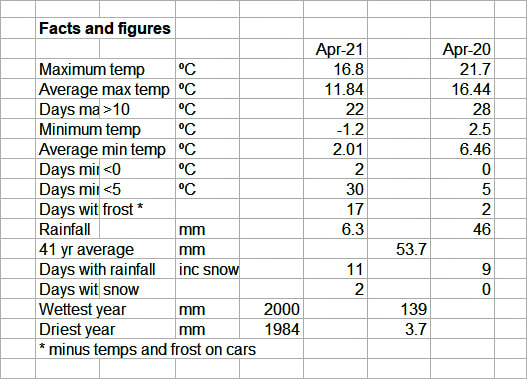
April was a month dominated by high pressure with winds primarily from the northern quarter. This resulted in a cold and very dry month.
The maximum and minimum temperatures and averages were well below April last year (although that was an unusually warm month). The Met Office have said that April was unusual for the high number of mornings with frost;
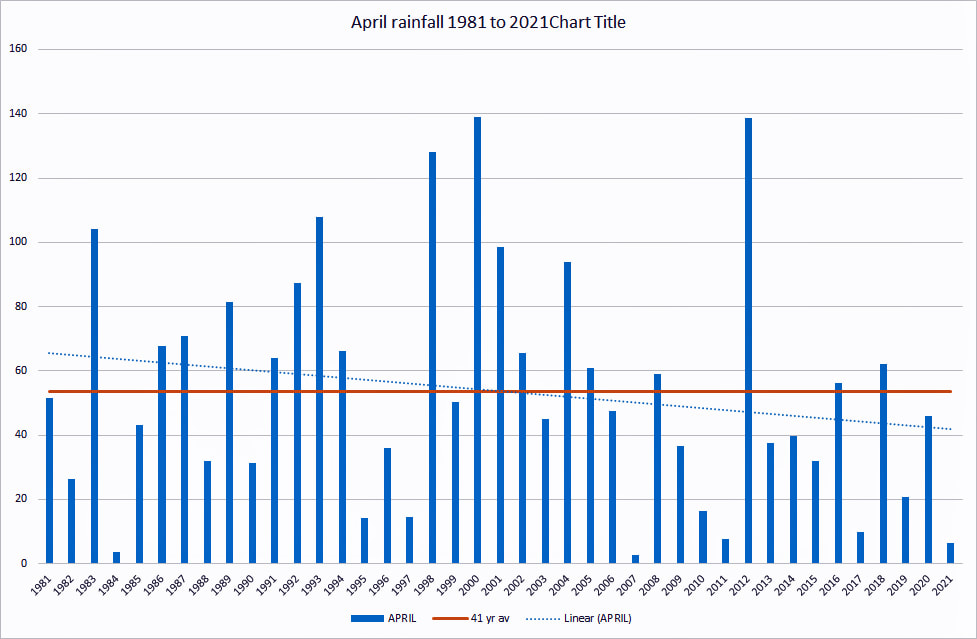
Hyde Heath was the same with frost evident on 17 days compared with just 2 last year. The rainfall trend over the past 41 years is for April on average to become drier falling from 65 to 42mm; this however shows wide variance from the wettest year in 2000 at 139mm to the driest in 1984 at just 3.7mm.
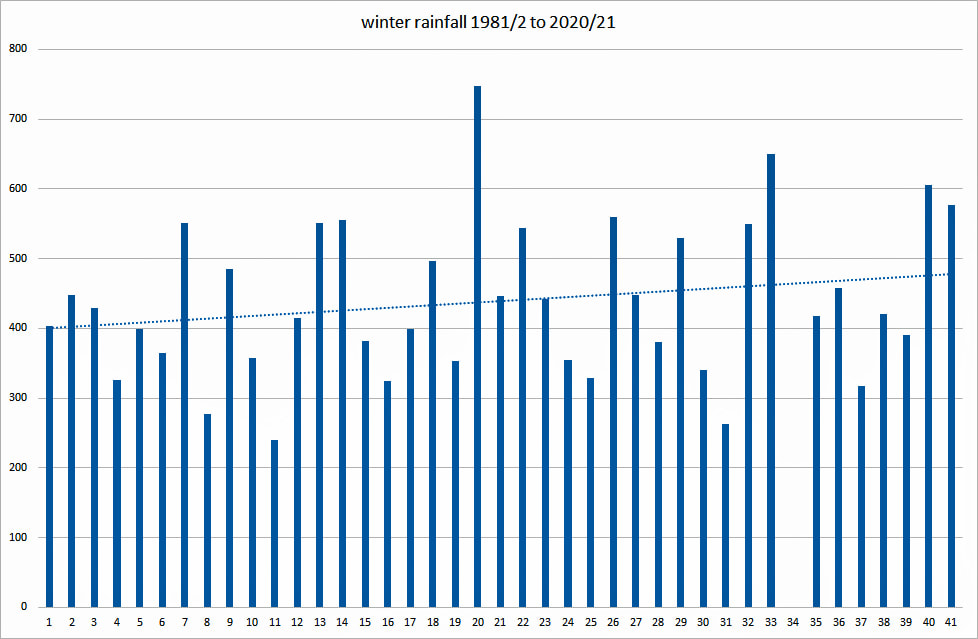
The winter rainfall ie October to March was high so the water table should be well up. The fact that the Misbourne is flowing well may be a result of this or that the Water Board are extracting less. Perhaps it will flood the HS2 tunnel---when it is eventually bored!
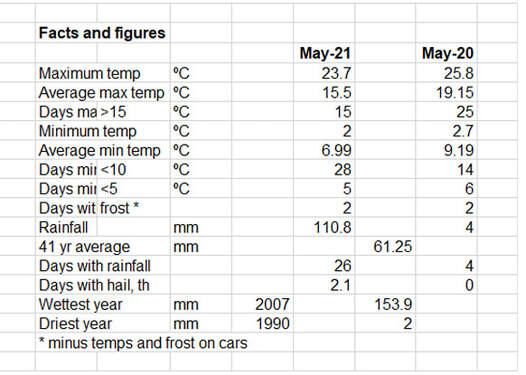
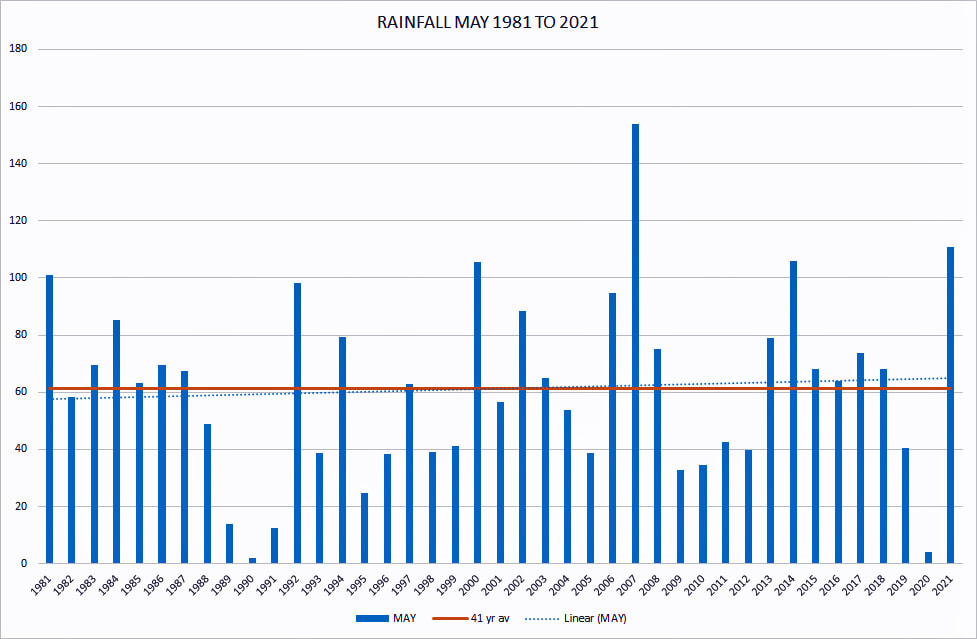
May was a very wet month; actually the second wettest in 41 years and a marked contrast from last year which was the second driest!
This year saw 110.5mm over 26 days compared with just 4mm in 4 days last year. Rainfall was nearly twice the 41 year average of 61.25mm and the trend over that period is only marginally showing an increase but there are significant year on year variations.
It was not especially warm with the average maximum temperature 3.5° lower than 2020.
There were only 2 days with the max greater than 20°compared with last year with 16.
Last May saw 18 days that were mostly sunny compared with this year with just 4. It did seem that April and May this year had swopped places.
June
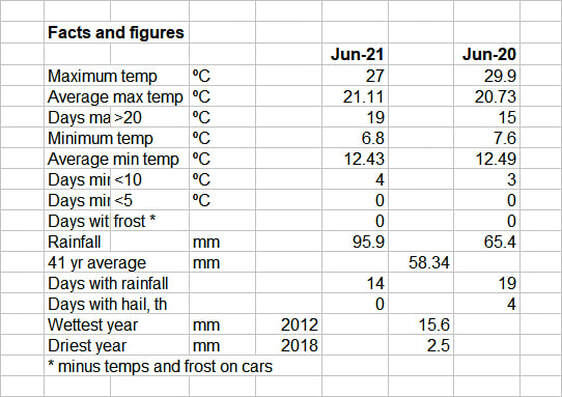
Yet again a month with two very different halves; the first 15 days were mostly sunny, mostly dry and temperatures in the mid to high 20s.
In contrast this with the latter part that saw nearly 90mm of rain, temperatures mostly in the “teens” and rather a lot of cloud.
The minimum temperature dropped to 6.8°C one night but earlier in the month the maximum day temperature was 27°C.
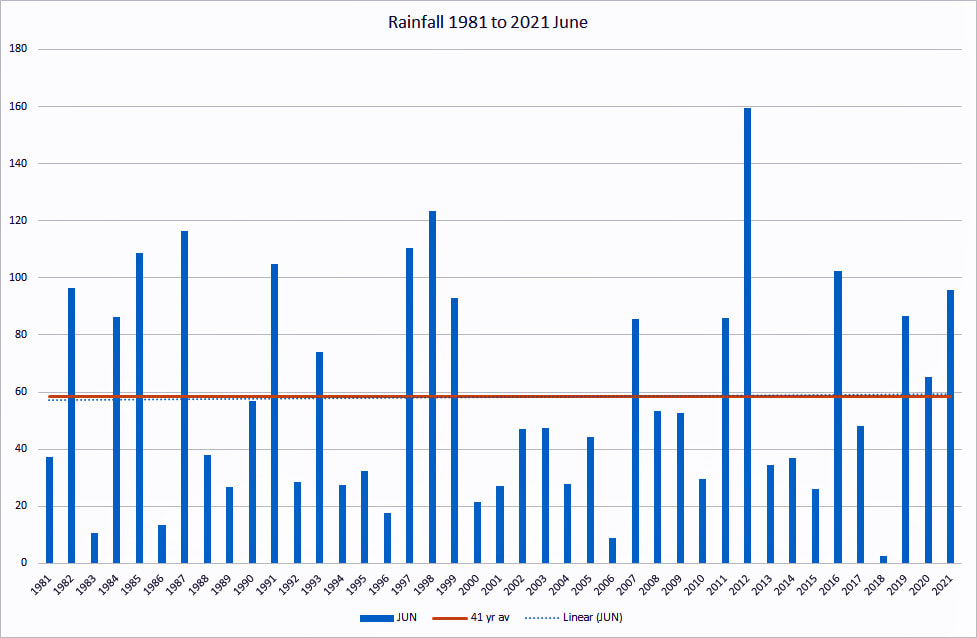
The rainfall at 95.9mm was above average for the last 41 years by over 50% but nowhere near the 2012 wettest year (159.6mm).
The driest year was in 2018 with just 2.5mm. If you look at the graph , you will see how wide the variation is year on year.
The trend line is however virtually flat.
By and large this June and June 2020 were not that dissimilar.
July
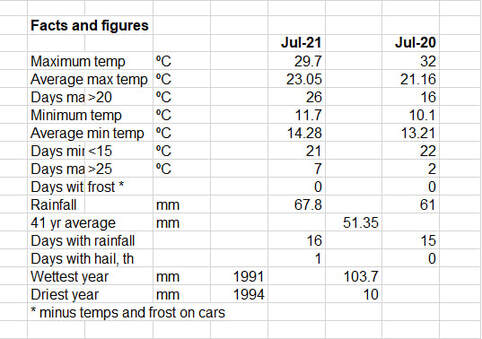
July started and finished with wet weather and was quite pleasant in the middle with temperatures rising to the upper 20s before falling back once the rain came.
There were 7 days with temperatures >25° and 26 days >20°. It was mostly sunny on 9 days.
All in all a fairly typical July. It compared closely with July last year with similar temperatures and rainfall.
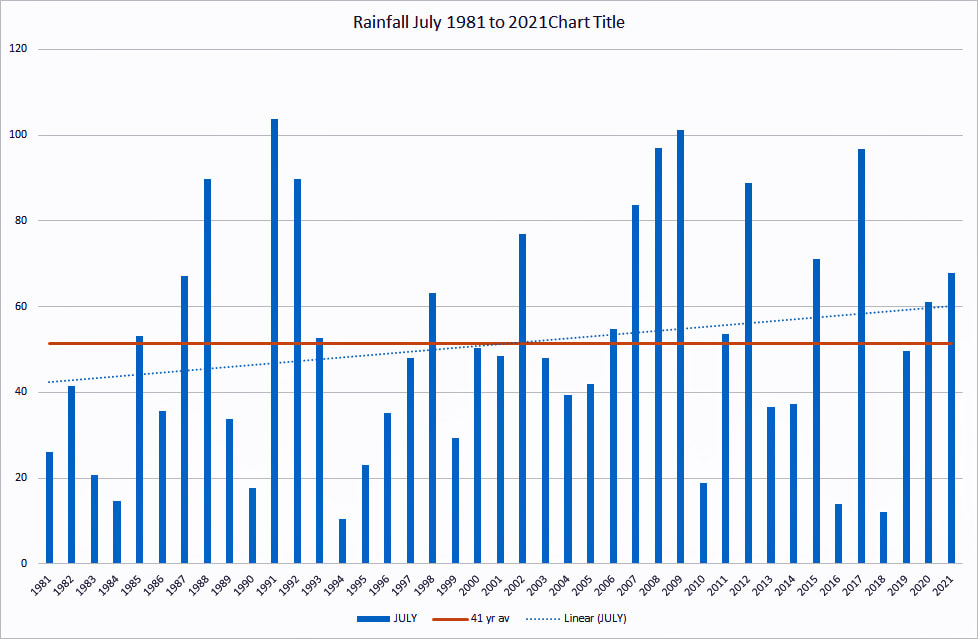
Over the last 41 years the rainfall has averaged 51.35mm; this year at 67.8mm was a little above average and there have been 18 of the years above but with a big difference from least to most: 10mm to 103.7mm.
The trend has been increasing; please look at the rainfall chart.
The weather in July and at the start of August has been a bit like late spring with wet and then warm which has encouraged the grass (and grain crops) to grow.
There was a good window for haymaking even though it was maybe 3 weeks later than normal.
August
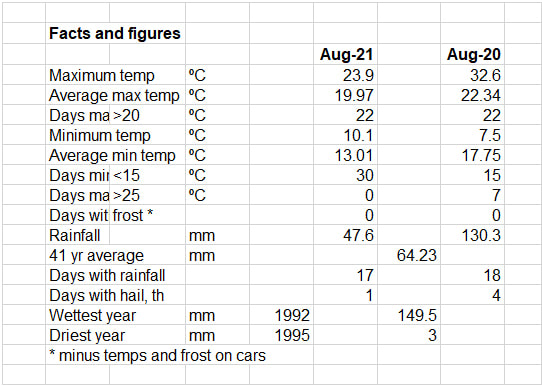
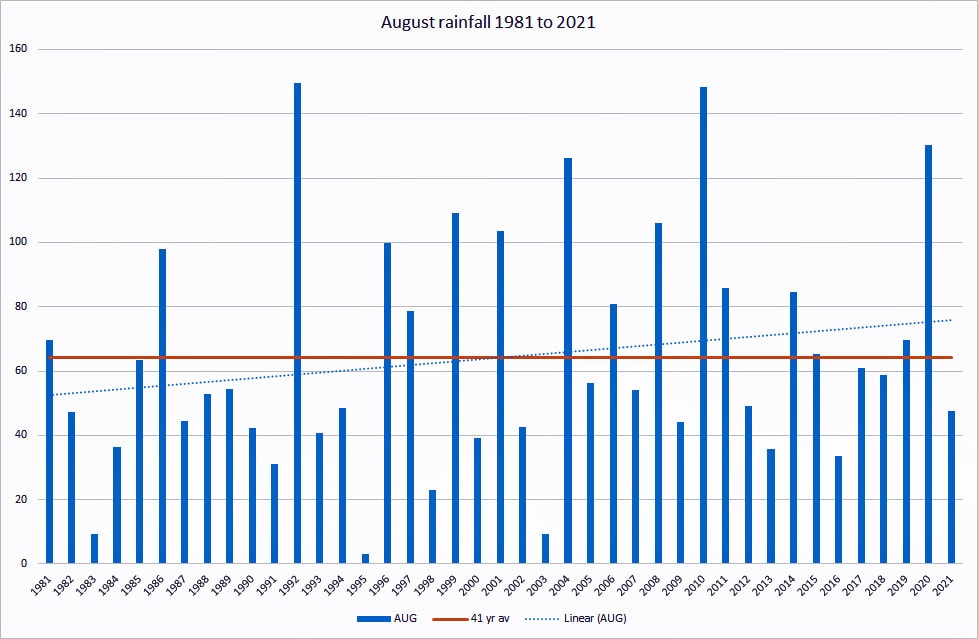
What a miserable month! Average temperatures were well below average, maximum temperature way below last year, cloudy days –too many.
What was “good” to say about it? Rainfall was below average but almost half of the 48mm came on just one day.
The latter part of the month was mostly dry although predominantly cloudy. The cause of this weather was a high pressure system that was positioned over the North Sea and bringing north easterly winds and driving cloud in.
Normally high pressure at this time of the year sits to the west of us and we have southerly winds bringing warmer weather up from the Azores.
The Met Office reported August as a whole as warmer than average but this was influenced by the weather and temperatures to the west and north of us. August 2020 was quite different; wetter but warmer with a maximum temperature of 32.6° and 7 days >25° (cf 23.9 and 0).
The pundits keep promising a hot spell; we live in hope.
September
We were promised an Indian summer in September; did it happen?
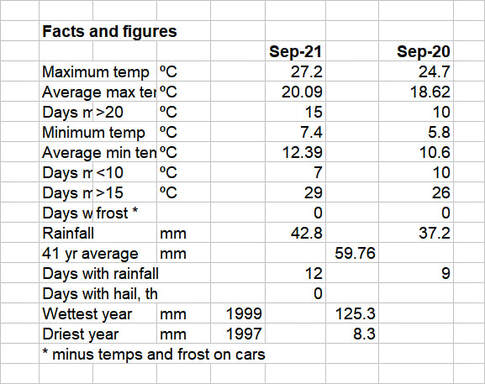
To some extent yes it did. Average maximum temperatures were above 20° and the maximum on 8th reached a giddy 27.2. There were some very pleasant sunny days as high pressure dominated the UK.
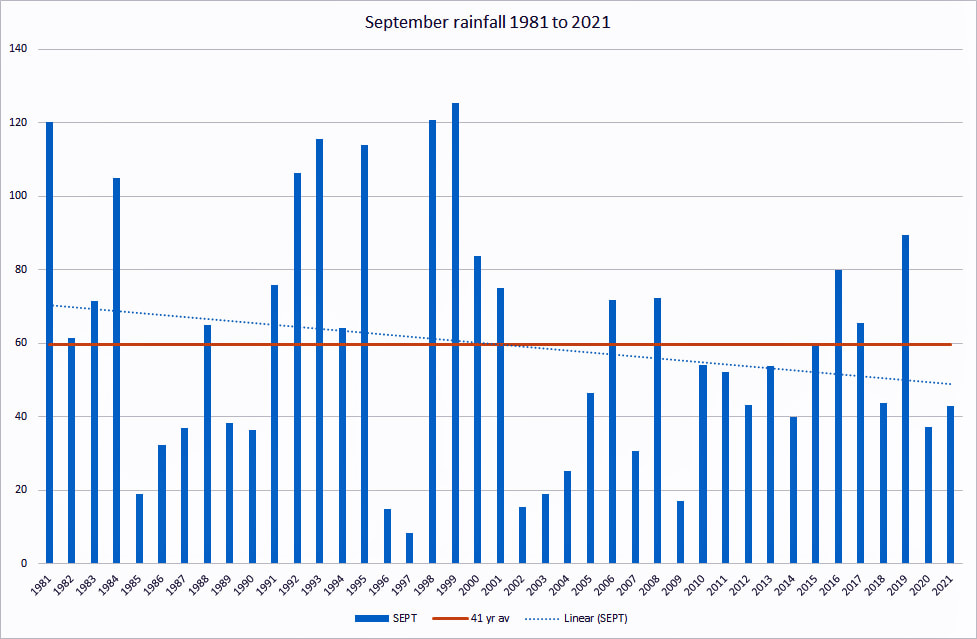
Against that there were also days with a lot of cloud and the end of the month turned out wet with nearly half the total rainfall of 42.8mm falling on 28th.The ground seems to have “sucked” it up like a sponge!
Compared with last September it was somewhat warmer, less cold but a little wetter.
Rainfall was below the 41 year average (59.76mm) and a fraction of 1999 when we had 125.3mm.
The rainfall trend is downwards but over the last 41 years we have seen a variation from 125 to 8mm with 19 years below the current average.
One report in the paper yesterday said we could have snow in October!! Let’s hope they are wrong.
October
COP26 is taking place in Glasgow at the moment and the delegates are looking at climate change and making pledges to take measures to mitigate the rise in temperatures.
Overall there can be no doubt that we are causing temperatures to rise globally but some of this may be the natural cycle of weather and this is very likely to be different in various parts of the world and even across the British Isles.
What is “it” doing in Hyde Heath? I probably do not have enough data even though I have been collecting figures for 41 years but one change that is surely apparent is that the Autumn is later than it used to be.
Weeks before now when I was younger we used to collect the leaves from the trees along the stone walls in Gloucestershire for the base of the bonfire; there were sack fulls of hem and the trees had lost most of their leaves—look at them now!
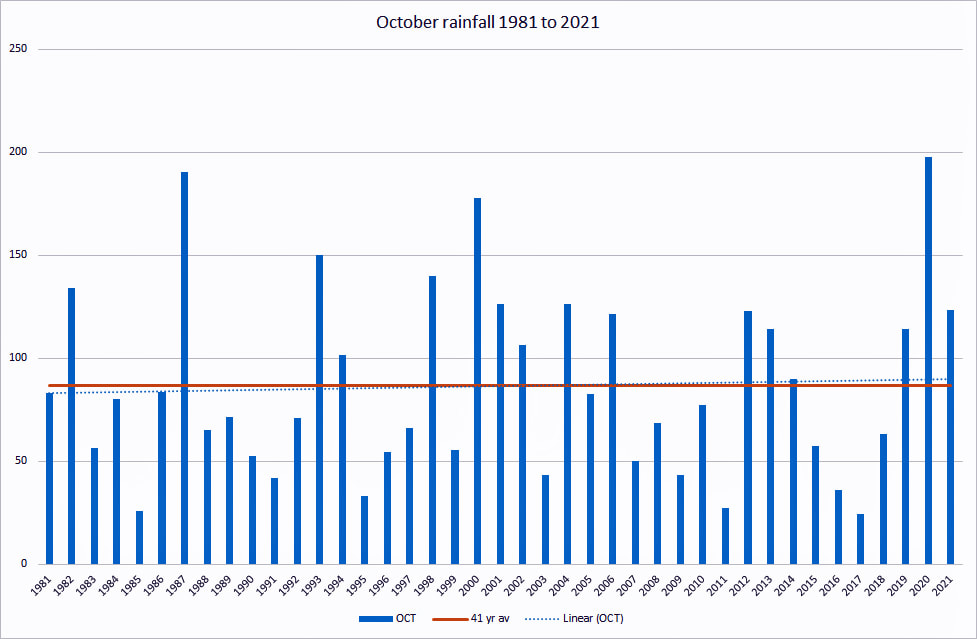
The rainfall trend over the last 41 years has only shown a very slight increase but with significant variations year on year I don’t think anything can be read into that data. Looking at a month in isolation is also not very scientific!
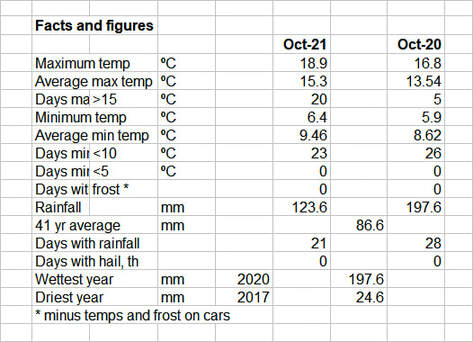
This October was wet but although 50% above average was well below last year (the wettest in 41 years).
Average maximum temperatures were some 2°higher than last year and minimum just over 1°. There were no frosts in October; my dahlias survived although the first few days of November are making them very vulnerable.
I wonder what someone will be reporting in another 40 years about our weather, hopefully saying that the global warming has been held and that an environmental disaster has been averted.
November
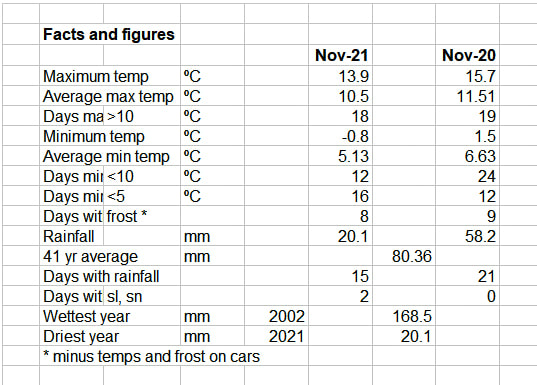
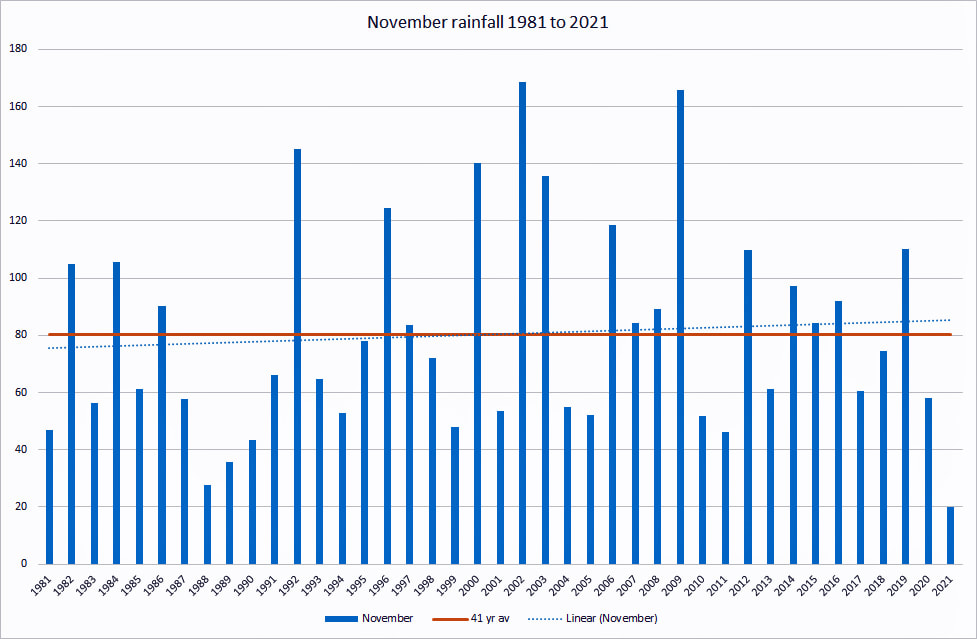
A big difference from October in that this November has been the driest in 41 years and well below the average
November has seen a wide variation in rainfall ranging from 168mm to 20mm with 18 years above the 41 year average of 80mm.The trend over that time shows a small increase. It was also a month with wide variations in temperature both in the weeks and on a day to day basis.
The first 20 days saw temperatures in the low teens whereas the last 10 days had much lower figures; the minimum temperatures were all over the place !
Warmer days but clear nights gave rise to a number of frosts and on 2 days the minimum was actually the previous morning with a marked rise through the day.
Then just to add to it all---snow, which thankfully didn’t last that long. We were fortunate that Storm Arwen at the end of the month had little impact upon Hyde Heath.
The leaves have finally mostly disappeared from the trees and it is quite noticeable haw much extra light there is in places like Pipers.
I don’t think there can be any doubt that Autumn is coming later certainly compared with some 50 or so years ago; global warming or just part of the natural cycle??
December
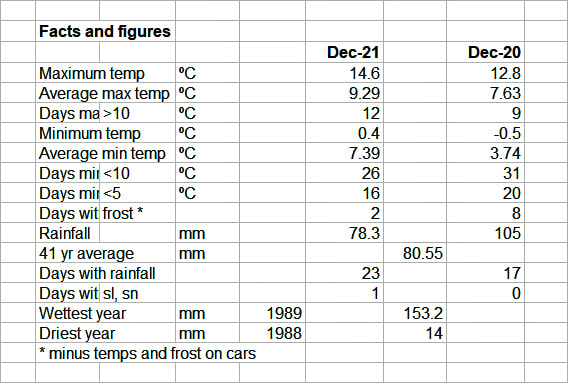
This December was a lot milder than 2020 and also drier. The end of the month saw some crazy temperatures for December with a maximum of 14.6°on the last day; compare that with 31st in 2020 at 1.6°. However it did snow right at the start of the month but, fortunately, that was the only time.
Temperatures were above 10°on 12 days and there was a lot of cloud. Somewhat unusually for this time of the year the high pressure that we experienced in the middle of the month gave us lots of cloud cover and not the clear sunny days with frosts over night that one would normally expect.
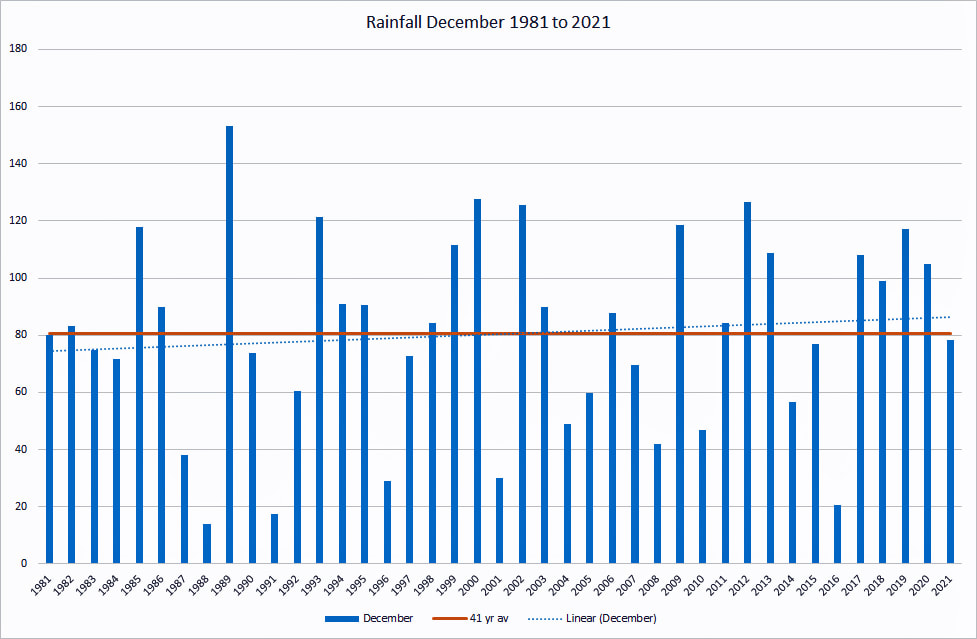
There were a lot of wet days-23 in all but 50% of the rainfall was in the last 8 days. The field that our pony is in is rather wet and muddy. Rainfall for the month was close to the 41 year average at 78.3 mm; lower than last year at 105 mm at with a trend in December that is creeping upwards.
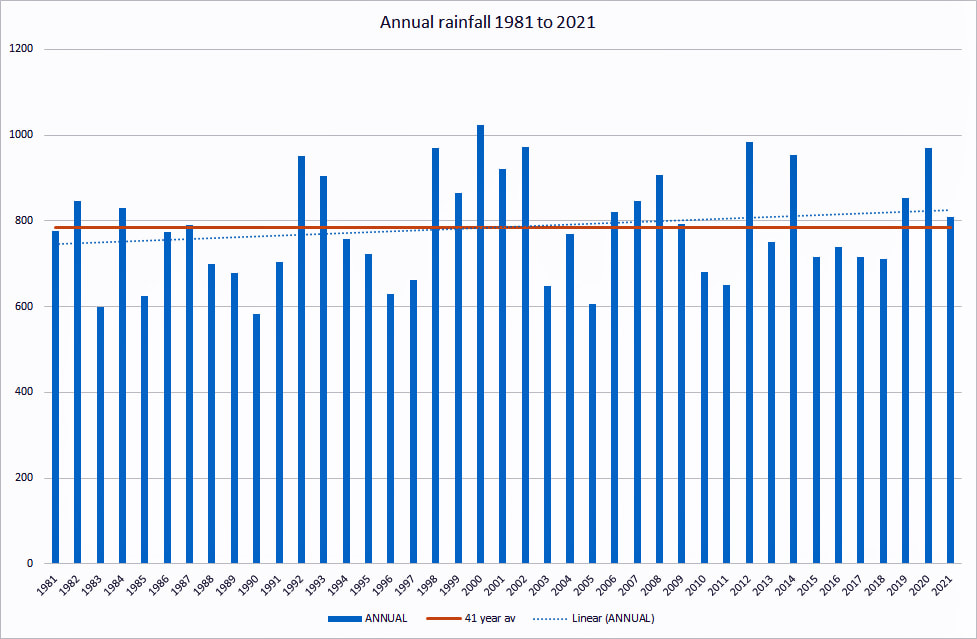
The rainfall for the year was 809mm a little above the 41 year average of 785 mm but the trend is actually showing an increase. The wettest year was 2000 with 1022mm and the driest 1990 at 582mm. 17 of the 41 years have been above average. What does all that mean? I am not sure! Probably that things sort themselves out in the long run.

